Responding to an inquiry this week, I needed to return to looking at trade, China’s exports and their effect on the North American steel casting industry. I thought for this month, it might be helpful to review this background data and some of the developments that will make this issue less of a factor for the future.
Table of Contents
Specification Committee Meeting
SFSA is actively involved in American Society for Testing and Materials (ASTM), International Organization for Standardization (ISO), Boiler and Pressure Vessel Code (BPVC), and American Welding Standard (AWS). The specification bodies foster collaborative development of commercial standards, which SFSA will work with to transition technologies into new or existing standards. These efforts are led by our Specification Committee, which will meet on May 9th in Denver, CO. For more information, please contact Dave.
Next Generation Manufacturing Meeting
SFSA works with ISU, UNI, EWI and SwRI on our three Next Generation Manufacturing (NGM) focus categories: Smart Automation, Smart Data, and ARtisan (technology for artisans). This year, kick-off meetings have been held for implementation of automated job shop grinding and Augmented Reality. In addition, projects with UNI under the Sensor Collective, and transition of EWI’s portable grinder, tele-arc-air, and robot torch cutting. NGM will meet on May 25th in Detroit, MI at the Automate show and in conjunction with SwRI’s ROS-I consortium annual meeting. Upcoming opportunities to work with UNI’s torch robot, Spira Systems automated flash grinding, or foundry implementation projects will be sent to the NGM mail list. For more information, please contact Dave.
77th Technical & Operating Conference
The T&O Committee is in the process of setting up this year’s conference. It will be on December 6-9 at the Loews Hotel in Chicago. If you would like to recommend a topic and presenter, please contact Dave.
Steel Casting Research
This month, we highlight our research into Grade Substitution. This work is intended to create guidance to understand the difference between grades. Besides understanding trade-offs in chemical composition or mechanical properties, it is important to have the engineering background of what and why other requirements are included in one specification compared to another. Like specification bodies, it is also important to use peer review for the guidance that is developed to know it is reliable. Enabling grade substitution can promote casting conversion and allow updating materials to commonly produced commercial grades. To learn more, the dashboards are available here. For any additional information, or sponsor a project or submit a research project, please contact Dave.
Cast in Steel 2023
YOU’RE INVITED
to the 2023
CAST IN STEEL COMPETITION
Featuring African Spears
Join us, along with teams from
32 universities for the
COMPETITION
Monday, April 24th
1:00 pm – 5:00 pm
Hilton Cleveland Downtown
100 Lakeside Avenue E
Cleveland, OH 44114
Room: Hope Ballroom
and the
AWARDS CEREMONY
Tuesday, April 25th
8:30 am – 9:30 am
Huntington Convention Center of Cleveland
300 Lakeside Ave. E
Cleveland, OH 44113
Room: 26ABC
Stop by the FEF booth at the Metalcasting Congress on
Tuesday afternoon to see all the spears on display

Members Luncheon and Roundtable
SFSA is arranging a lunch for members and invited guests on Tuesday, April 25th at 11:30 a.m. Lunch will be at Sausalito on Ninth, 1360 East 9th Street, Cleveland, OH. Cost of lunch is $47. This will be an opportunity to network with other SFSA members and participate in a steel foundry roundtable discussion after lunch.
Registration is required. For more information, contact Renee Mueller – rmueller@sfsa.org.
Market News
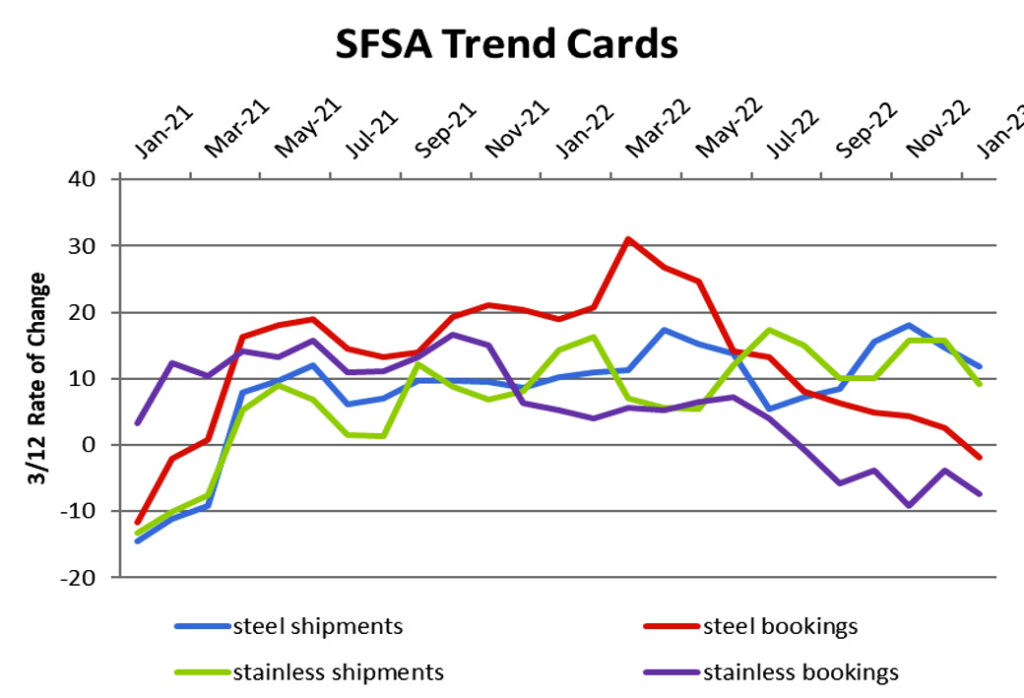
For the January 2023 SFSA trends report, the 3MMA for steel casting bookings was negative for the first time since February 2021. The 3MMA for stainless bookings has hovered around 6-7% below year ago levels since September 2022. Steel and stainless shipments remain above prior year levels but continue to trend downwards. Median backlog for steel and stainless steel castings is 14 weeks and 12 weeks respectively.
Steel production, price of oil, and price of copper are correlated with steel casting sales. The American Iron and Steel Institute (AISI) reported that 2022 steel shipments were down 5.5% from 2021 levels, and January 2023 steel shipments were down 7.9% from January 2022. Oil prices have continued a downward trend in recent weeks driven by several factors in macro news including recession fears and bank closures. Copper rallied at the beginning of the year, with January prices hitting their highest point since June, but has since stalled amid weak global manufacturing.
Spring Leadership Meeting and Foundry Tours
Save the dates! SFSA is planning the next Spring Leadership and board meeting for the week of May 1st in Guadalajara, Mexico with the opportunity to tour the new POK foundry in addition to the original POK and Fimex. Tentative agenda is as follows:
Monday, May 1st – Arrive in Guadalajara
Tuesday, May 2nd – Tour POK facilities, industry roundtable
Wednesday, May 3rd – Tour Fimex, SFSA Board meeting in the afternoon
Hotel and meeting registration will be sent out soon.
Casteel Commentary
China had a deliberated and desperate strategy after ascending to the WTO in 2001. With a large population and growing economy, multi-national OEMs were encouraged to locate manufacturing in China to lower costs and to gain a share of the faster growing economy compared to the slowing growth rate of the developed countries, the EU, North America, Japan, etc. China sought to use the developed countries manufacturing technology to gain a dominant position for economic and national security with the goal of becoming the dominant player in the world.
The graph above shows the rapid growth of China’s exports and imports after 2001. One notable feature is that the exports from China depend fundamentally on the imports to China. China is not taking resources native to China and processing them for export, they are processing imported materials with imported energy to produce the goods they export.
This deliberate policy of investing and developing dominant positions in basic industries and materials is mirrored in the expansion of steel casting production seen in the graph. China went from parity with the U.S. in 1998 to grow to half the world’s production by 2018 while the U.S. remained level at around 1 million tons.
The graph above shows countries that are the major import sources, China and India imports are about 10% of the size of U.S. production of steel castings. Canada and Mexico with the USMCA (new NAFTA) should probably be counted as a regional source and not an import challenge.
China is the largest source of imported steel castings, mainly in larger volume commodity castings like rail parts, mining consumables and valve bodies. Making China a reliable source has been challenging for the OEMs requiring management and control over the entire supply chain all the way to the foundry floor. In addition, corruption remains a cost and requires staff rotations to avoid the ability to corrupt the oversight. Limited production of complex castings has not been successful due to the high cost of management and the challenge of more complex and stringent requirements. There is not enough money in the system to provide the oversight required to get these castings. One unique challenge has been the China lost wax process that gives near investment casting surface quality at costs that rival production sand producers in North America. Other large volume products in aluminum die casting and iron sand shops have been more amenable to imports. The size of the casting market in the U.S. from AFS is about $40 billion and the total export of all castings from China reported by the WTO from China sources for 2017 was $2.5 billion.
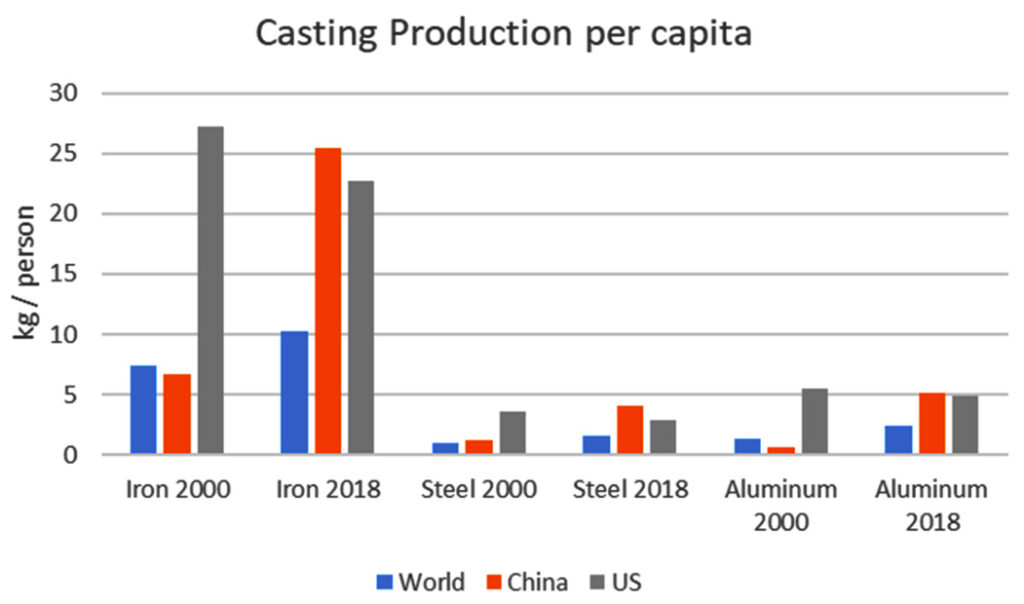
One way to understand the production levels of castings relative to the size of the country is to calculate the per-capita production rate. The graph above shows the per-capita rates for iron, steel and aluminum castings. The U.S. shows a slight decline while the China and the world show increases. China shows the dramatic growth discussed above exceeding the per-capita production of the U.S. significantly.
Our public policy that we have considered before in this newsletter discourages investment in capital-intensive industries, so many U.S. producers are foreign owned. Imported castings are not made to higher quality or more efficient utilization of materials, energy or labor but are less expensive based on our trade policy and the public policies in the countries we import from. With the re-regionalization of manufacturing to gain benefits for economic and national security, we will likely see support for investment and expansion for the next few years. In particular, dependence on China as a major source for domestic infrastructure needs is likely to evaporate within a decade.
As seen in the first graph, China’s dependence on imports to provide the materials and energy required for producing their exports depends fundamentally on the U.S. to secure the oceans to allow free passage of trade goods. This was instituted by the U.S. from the dominant post-WWII position and was a component of the Cold War strategy to get alignment of allies to counter the Soviet threat. Even the policy of detente with China was instituted to isolate and contain the Soviet threat. The U.S. was too successful and is no longer as large in GDP as the rest of the world combined. The current geopolitical situation makes global trade increasingly problematic and will add costs if not limits to global trade.
Demographics https://upload.wikimedia.org/wikipedia/commons/7/7d/China_population_pyramid_from_2023_to_2100.gif
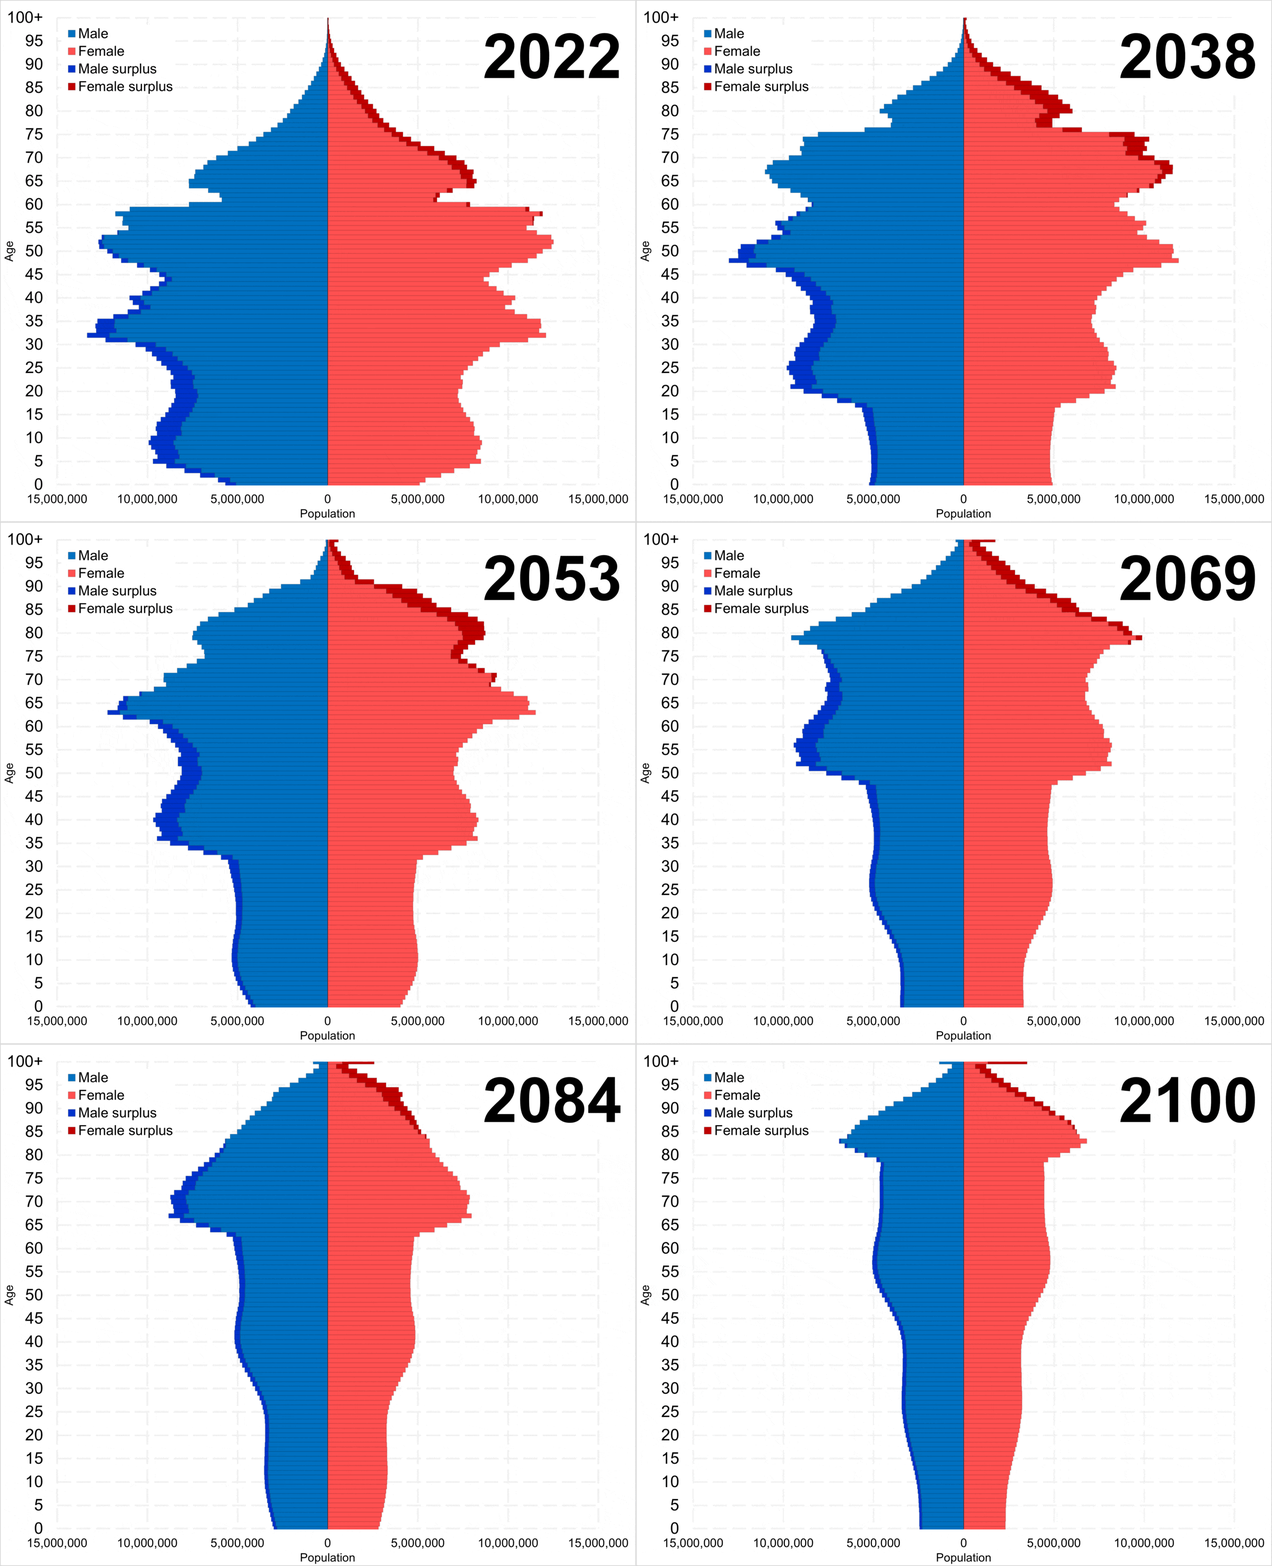
In some ways, more important than the economic and political challenges in the world, demographics will become decisive. As the graph above shows, China is in the irreversible process of collapse. Others like Russia are in a similar situation but China has the most severe and the most imminent problem with population collapse. Last year, China’s population shrunk by 850,000 people. (https://www.businessinsider.com/china-shrinking-population-worker-labor-shortage-grim-omen-global-economy-2023-2)
Their statistics were corrected showing a smaller population and more critical, the population overstatement is of the less than 40 year olds. The animated graph above shows rapid and continued loss of population through the end of the century.
Some credible estimates assert that North America will need to double our industrial capacity to meet the current needs of the regional population. While Canada will shrink more rapidly, U.S. will shrink less rapidly, Mexico will have the slowest decline in population and the most opportunity for growth. The current USMCA provides a platform for an effective regional response to our changing world.
One concerning and coming challenge is the slowing growth rate of population and investment in industrial equipment will make economic growth slower and maybe stagnant. While we may grow rapidly if we need to double in size for re-regionalization, the underlying economic state of the world is likely to decline. As the best situated region, we are well positioned, if we can respond to the challenge, to grow to replace imports and to become a major exporter of agricultural and manufactured goods. The structural and systemic obstacles that remain are the public policies that discouraged capital intensive industry investment and ownership. The recognition of the need for us in manufacturing is currently seen as a lack of capital and the solutions are proposed to be some form of corporatism.
Capitalism relies on government to maintain a system with stability and security so that private actors can produce and sell based on perceived market value. Socialism is when the government assumes ownership of major industries to meet the perceived economic and national security needs. Corporatism is when government invests and manages their purchases to maintain the industries targeted as essential. This move to corporatism has already been characteristic of the major defense OEMs. With the concerns about defense supply chains and the policy mandates to develop green technologies that both depend on a manufacturing base that is too small and inadequately funded, there are programs and funding for manufacturers to invest to expand and meet these needs.
Wow, we have many opportunities, challenges, threats and uncertainties that confront us. As the SFSA, we want to continue to understand and respond to your needs and direction. As USMCA moves to more regional solutions and government becomes more deeply involved in the financial structure, we will need to be clear headed on how we can shape and prosper and grow in supplying the steel castings that are so needed.
Raymond
Raymond
| STEEL FOUNDERS' SOCIETY OF AMERICA BUSINESS REPORT | ||||||||||
|---|---|---|---|---|---|---|---|---|---|---|
| SFSA Trend Cards (%-12 mos. Ago) | 12 Mo Avg | 3 Mo Avg | January | December | November | |||||
| Carbon & Low Alloy | ||||||||||
| Shipments | 12.6 | 11.9 | 13.5 | 6 | 16.3 | |||||
| Bookings | 10.8 | -1.8 | -8 | 1 | 1.6 | |||||
| Backlog (wks.) | 14 | 13.9 | 14 | 12.8 | 15 | |||||
| High Alloy | ||||||||||
| Shipments | 10.5 | 9.2 | 2 | 5.5 | 20 | |||||
| Bookings | -0.5 | -7.3 | -4.5 | 2.5 | -20 | |||||
| Backlog (wks.) | 12.4 | 11.1 | 12 | 11.2 | 10 | |||||
| Department of Commerce Census Data | ||||||||||
| Iron & Steel Foundries (million $) | ||||||||||
| Shipments | 1,496.20 | 1,521.30 | 1,582 | 1,497 | 1,485 | |||||
| New Orders | 1,522.20 | 1,515.70 | 1,537 | 1,480 | 1,530 | |||||
| Inventories | 2,710.60 | 2,800.30 | 2,826 | 2,795 | 2,780 | |||||
| Nondefense Capital Goods (billion $) | ||||||||||
| Shipments | 81.6 | 84.9 | 84.4 | 85.2 | 85.1 | |||||
| New Orders | 86.6 | 89.1 | 84 | 99.1 | 84.3 | |||||
| Inventories | 213.2 | 217.7 | 218.1 | 219 | 216 | |||||
| Nondefense Capital Goods less Aircraft (billion $) | ||||||||||
| Shipments | 73.7 | 75.1 | 75.5 | 74.6 | 75.1 | |||||
| New Orders | 74.2 | 75 | 75.4 | 74.8 | 74.9 | |||||
| Inventories | 148.2 | 153 | 153.8 | 153.2 | 152 | |||||
| Inventory/Orders | 2 | 2 | 2.04 | 2.05 | 2.03 | |||||
| Inventory/Shipments | 0 | 2 | 2.04 | 2.05 | 2.02 | |||||
| Orders/Shipments | 0 | 1 | 1 | 1 | 1 | |||||
| American Iron and Steel Institute | ||||||||||
| Raw Steel Shipments (Million net tons) | 7.4 | 7 | 7.1 | 6.9 | 6.9 | |||||
