Supply chain analysis and labor productivity…
Table of Contents
Research Review, July 19-22
Please make your plans to participate in the annual SFSA Research Review on July 19-22. This year’s meeting will be held in-person in Rosemont, IL. The Review covers the latest in both Carbon & Low Alloy and High Alloy steel casting research under the DID, ICT, and SPI programs. The meeting is also your opportunity to interact with the researchers and provide industry steering. The event vets our research portfolio to select the R&D projects to be featured at the National T&O. Registration is required and must be completed by June 27, Monday: https://sfsa.site-ym.com/events/EventDetails.aspx?id=1640040 .
Similar to previous years, we request you consider inviting a handful of key contacts at your customer or even a potential customer for the Design Day on July 21-22. A separate registration link is provided for non-members here: https://www.surveymonkey.com/r/7CW752N . For any questions, contact Dave Poweleit.
Research Highlight
Iowa State University (ISU) developed a digital surface inspection method to establish a more objective and quantitative method for evaluating surface roughness of steel castings. The method uses the 3D scan of the casting to calculate the surface roughness value. Laser scans of SCRATA A comparator plates provided by member foundries were used in the development of this method. It was further refined using scans of actual castings. A quantitative NDT method such as this could be leveraged in establishing the relationship between casting quality conditions and casting performance.
The ISU team is now working on transitioning this method to industry. They have drafted an ASTM standard which will potentially be developed under the guidance of ASTM A01.18 Steel Castings Subcommittee. ISU also developed a software called SurfInspect which processes the point cloud data and outputs the surface roughness number and what its equivalent level per surface comparator plates (SCRATA, GAR C-9, ACI) is.
Critical feedback from foundries on the draft standard and the software are needed. If you are interested in providing input, please reach out to Dave Poweleit. A copy of the draft standard and the link to access the software and video tutorials will be shared for your review.
Member Interns: Peaslee & Schumo Scholarships
Recruiting students to join our industry and grow into leadership positions remains a critical need in the steel casting industry and a strategic initiative of the Society. The Steel Founders’ Society Foundation aims to attract the next generation workforce by providing scholarships to student interns. To compete for the scholarships, interns are required to work at a member foundry and carry out a specific task or investigation. Selected works are presented at the annual T&O conference. If you currently have or plan to have an intern work at your foundry in 2022, be sure to encourage them to submit a paper and presentation to Renee Mueller by August 19. Find out more about the scholarships at https://www.sfsa.org/scholarships
Cast in Steel
See all the excitement of the 2022 Cast in Steel Competition HERE. Watch our website around the end of August for information on the 2023 CIS Competition.
Market News
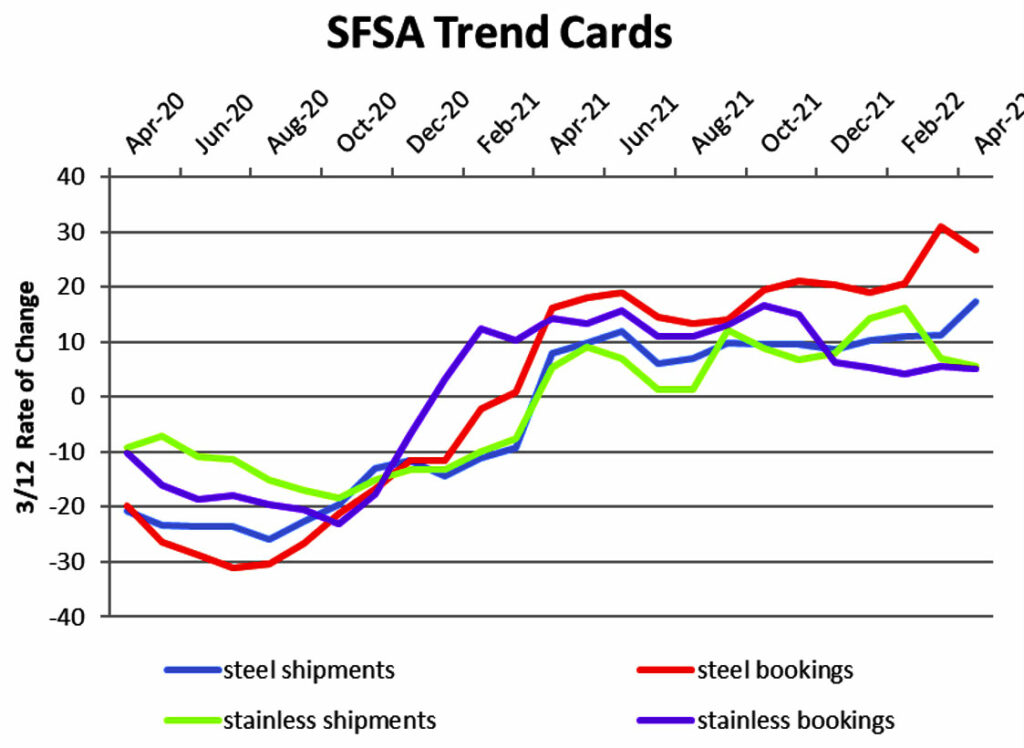
The April SFSA Trends report shows slowing growth for steel casting bookings as stainless bookings and shipments continue to trend around 5% above year ago levels. The median backlog for steel castings is 16 weeks, down slightly from the record high in March at 17 weeks. The median backlog for stainless is 13.5 weeks compared to 15 weeks reported in March.
Last month, the US Census Bureau revised the historical data for new orders. This resulted in a downward revision in new orders for recent quarters for most of the steel casting markets. The highest revision was a 10% reduction in the 12 MMT (monthly moving total) for nondefense capital goods excluding aircraft, with many of the markets seeing a 5-6% reduction. ITR revised their forecast accordingly but still anticipates slowing growth will be the predominant trend for most markets through the rest of this year and well into 2023.
Casteel Commentary
As a result of our ongoing close working relationship with the U.S. DoD on supply chain, we have done some analysis supply chain issues and the challenge of China’s investments to dominate the industrial materials supply globally. To measure how productive and efficient steel foundries are, we analyzed and presented at the Spring Leadership meeting an overview of steel foundries compared to other steel suppliers and to steel using industries. The full presentation is located here.
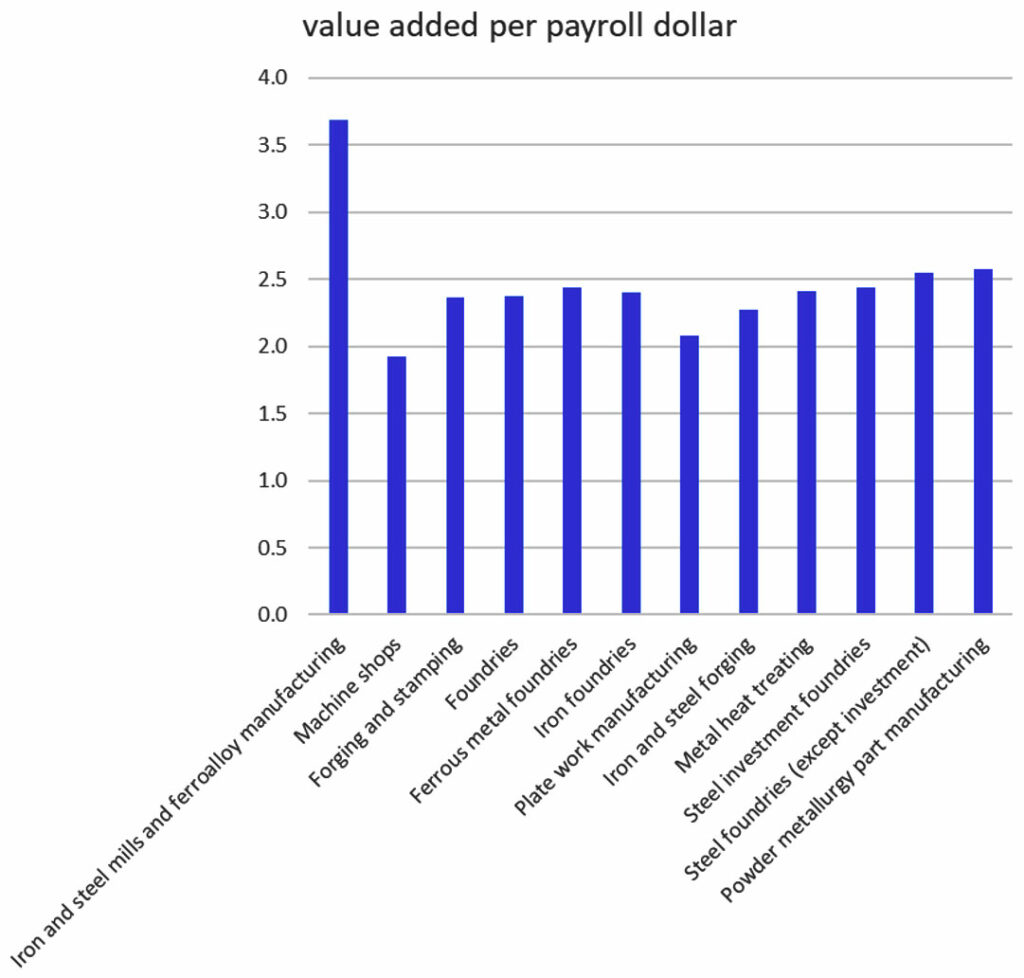
One particular area of interest is our labor productivity. This is hard to measure in a meaningful way. Steel foundries used to compare manhours per ton as a metric but product type, size, quality requirements, volumes, etc. made this metric incomparable between operations. Large OEM firms began in the last decade to compare sales per employee as a metric. This was problematic because brokering sales or purchasing and assembling without manufacturing, gives large numbers unrelated to the value added. In addition this can be manipulated by overtime, subcontracting, etc.
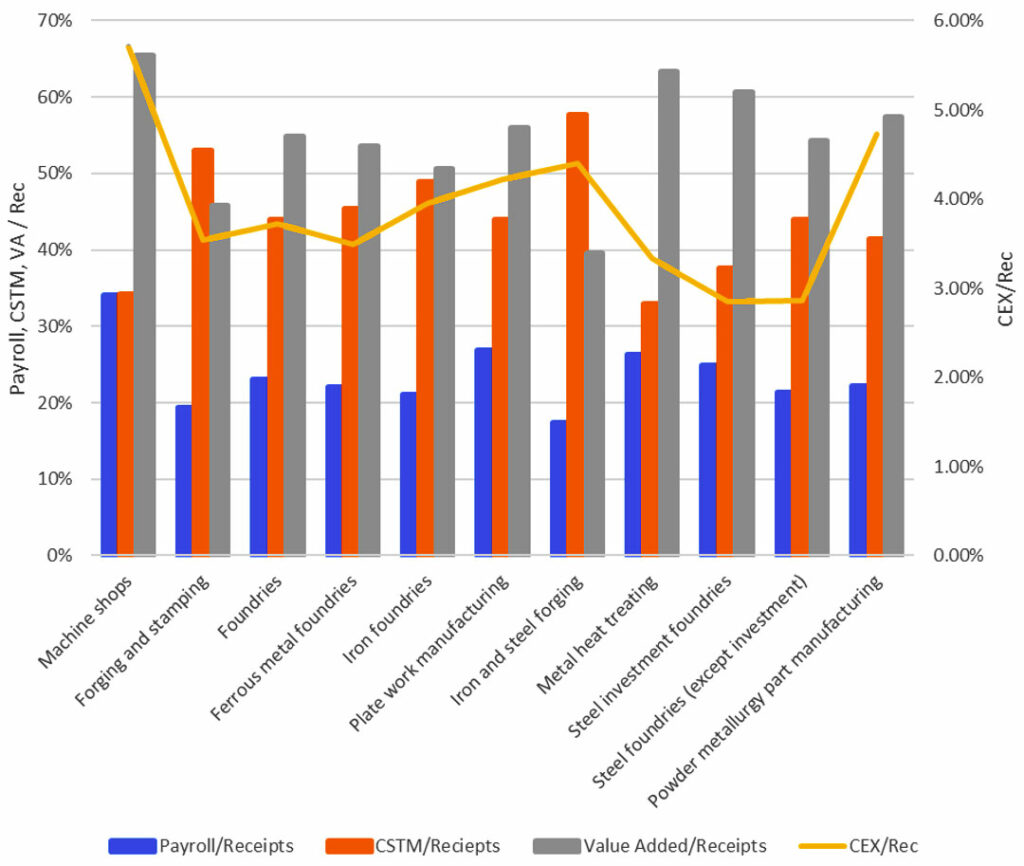
We proposed using the value added as a multiple of the payroll costs as the cleanest and best metric for labor productivity. By this metric, steel foundries are among the leaders in using labor to create value as seen in Figure 1. This Census data on manufacturing also allows a picture of the distribution of costs for manufacturing compared to receipts shown in Figure 2. Steel foundries are competitive in labor productivity but are severely lacking in capital investment. With the capacity limits and price volatility, we need to develop comprehensive capital investment plans and business practices to allow our industry to modernize, innovate and automate to survive and prosper.
Raymond
| STEEL FOUNDERS' SOCIETY OF AMERICA | ||||||||||
|---|---|---|---|---|---|---|---|---|---|---|
| BUSINESS REPORT | ||||||||||
| SFSA Trend Cards (%-12 mos. Ago) | 12 Mo Avg | 3 Mo Avg | April | March | February | |||||
| Carbon & Low Alloy | ||||||||||
| Shipments | 10.8 | 17.3 | 26 | 16 | 10 | |||||
| Bookings | 19.9 | 26.7 | 12 | 43.2 | 25 | |||||
| Backlog (wks) | 12.4 | 16.3 | 16 | 17 | 16 | |||||
| High Alloy | ||||||||||
| Shipments | 7.5 | 5.7 | 6 | 0.1 | 11 | |||||
| Bookings | 9.5 | 5.2 | 9.5 | 0 | 6 | |||||
| Backlog (wks) | 12.1 | 13.8 | 13.4 | 15 | 13 | |||||
| Department of Commerce Census Data | ||||||||||
| Iron & Steel Foundries (million $) | ||||||||||
| Shipments | 1,397.00 | 1,475.30 | 1,529 | 1,462 | 1,435 | |||||
| New Orders | 1,524.00 | 1,598.00 | 1,661 | 1,607 | 1,526 | |||||
| Inventories | 2,466.00 | 2,626.30 | 2,653 | 2,623 | 2,603 | |||||
| Nondefense Capital Goods (billion $) | ||||||||||
| Shipments | 79.9 | 78 | 78.5 | 77.9 | 77.6 | |||||
| New Orders | 87 | 83.3 | 83.5 | 83.1 | 83.4 | |||||
| Inventories | 204.6 | 208.7 | 210.2 | 209.1 | 206.7 | |||||
| Nondefense Capital Goods less Aircraft (billion $) | ||||||||||
| Shipments | 74.7 | 71.7 | 72.2 | 71.6 | 71.4 | |||||
| New Orders | 76.6 | 72.7 | 73.2 | 72.9 | 72 | |||||
| Inventories | 138.8 | 143.1 | 144.3 | 143.4 | 141.6 | |||||
| Inventory/Orders | 1.8 | 2 | 1.97 | 1.97 | 1.97 | |||||
| Inventory/Shipments | 0 | 2 | 2 | 2 | 1.98 | |||||
| Orders/Shipments | 0 | 1 | 1.01 | 1.02 | 1.01 | |||||
| American Iron and Steel Institute | ||||||||||
| Raw Steel Shipments (million net tons) | 7.9 | 7.6 | 7.6 | 7.8 | 7.2 | |||||
