Table of Contents
Making Steel Castings Webinar for Customers
Making steel castings is best accomplished when the foundry collaborates with the designer and purchaser. A customer specifies the requirements of a casting including the design; geometry and quality affect both performance and manufacturability. A foundry engineer designs the rigging and solidification in the mold for cost-effective manufacturing of a quality steel casting; solidification modeling or casting simulation software is a powerful tool for rigging but does not address manufacturability. A partnership between the foundry and customer to optimize the part geometry and quality will yield the best part solution for manufacturability and part service. This comprehensive webinar provides a core understanding of the trade-offs that are made to make steel castings:
- Introduction
- Foundry Differences
- Simulation Limitations
- Foundry Engineering Trade-offs
- Directional Solidification – modulus
- Directional Solidification – thermal gradient
- Directional Solidification – feeding
- Finishing of Castings (arc-air)
- Case Study I
- Case Study II
- How Customers Can Help and Conclusions
This webinar series is now available to members to share with their customers. SFSA’s whitepaper on Source Selection provides additional detail on identifying capable foundries.
79th Technical & Operating Conference
Mark your calendar – the T&O Conference will be held in Chicago December 11-13, with a member workshop on Wednesday December 10.
Fall Leadership Meeting
Mark your calendars to attend the Fall Leadership Meeting on September 19-22, 2025, at the Hotel Terra in Jackson Hole, WY.
This year’s business sessions will include:
- Concurrent Design of Materials and Systems, Charles Kuehmann, SpaceX
- Economic and Global Update, What Now? Chris Kuehl, Armada Corporate Intelligence
- Brining Military Practicality to Foundry AI, Fred Addy, Abelian
- The Trump Administration, Trade Policy and Trade Remedy Investigations, Dan Pickard, Buchanan Ingersoll & Rooney
- Drive Productivity Through Common Tools and Best Practices in Novel Robotics Software, Matt Robinson, Southwest Research Institute
- State of the Steel Casting Industry, Raymond Monroe, SFSA
- SFSA 2026 Market Forecast, Joe Plunger, Midwest Metal Products
Registration is now open. A reduced rate has been established for first time attendees, spouses, and SFSA Alumni. Hotel reservation cutoff is August 18th!
Cast in Steel 2026 – Horseman’s Axe
Cast in Steel 2026 Season 2 will be a competition to produce a Horseman’s axe using casting.
Robert the Bruce, King of Scotland, used an axe to defeat Henry de Bohun in single combat at the start of the Battle of Bannockburn in 1314. Given that Bruce was wielding the axe on horseback, it is likely that it was a one-handed horseman’s axe. They enjoyed a sustained revival among heavily armored equestrian combatants in the 15th century.
Grand Prize will be $25,000 for the winning team
IMPORTANT EVENTS & SUBMISSION DATES
Friday, December 5, 2025 Proposed teams, and preliminary plan requested.
Friday, March 27, 2026 Project video, technical report, are due.
Friday, March 27, 2026 Horseman’s axe shipped by.
April 13-17, 2026 Cast in Steel performance testing
More information here: https://castinsteel.org
Casting Dreams 2026 – Host or Sponsor a Local Competition!
Casting Dreams is a national metalcasting competition created by the Steel Founders’ Society of America (SFSA) for students ages 8–18. It’s a fun, hands-on opportunity for young people to design and create their own metal castings—from start to finish—using any type of metal.
How it Works:
✔️ Students can use scratch or custom molds
✔️ Final castings must weigh 10 lbs. or less
✔️ Projects can be any original cast metal object
We’re now inviting foundries and organizations to host or sponsor a local Casting Dreams competition. Local winners will move on to the National Competition held at the MetalCasting Congress in April 2026 in Grand Rapids, Michigan.
Want to get involved?
Visit www.castingdreams.org and fill out the host/sponsor form.
We’ll provide support to make your event a success!
Questions?
Contact Renee Mueller at rmueller@sfsa.org Let’s make 2026 a year of creativity and innovation.
Interns/Scholarships
Got Interns?
Let them know about the 2025 SFSA Foundation Scholarships!
Deadline is Approaching – August 15!
All materials must be submitted by then to be eligible.
Let’s celebrate your hardworking intern.
Scholarship Opportunities Include:
- The Schumo Scholarship
- The Peaslee Scholarship (project must focus on melting or refining)
- Jim and Betsy Cooke Memorial Scholarship Fund
- Christoph Beckermann Memorial Scholarship Fund
Eligibility Requirements:
To be considered, interns must:
- Work at an SFSA member foundry during 2025
- Complete a defined project (not just serve as an extra set of hands)
- Submit a written paper and PowerPoint presentation detailing their project
- Have their submission reviewed and approved by a supervisor
- Be willing to present their project at the 2025 National T&O Conference in Chicago on Friday, December 5, 2025.
How to Apply:
- Submit a paper and PowerPoint about their completed project
- Make sure both are reviewed and approved by a supervisor
- Email all materials to Renee Mueller at rmueller@sfsa.org by August 15, 2025
Questions? Contact Renee at rmueller@sfsa.org or 847-431-5405.
Encourage your interns to apply! This is a great opportunity to recognize their hard work.
Scholarship funds are to be used by the student to pay for qualified educational expenses as defined by the Internal Revenue Service.
Market News
ITR reports that U.S. Industrial Production is projected to reach record highs, driven by onshoring and stable consumer and business finances. Growth will be modest due to mature markets, high interest rates, and policy uncertainty. Most manufacturing sectors will gain momentum through 2026, with a softer 2027 expected. Industrial growth will remain in the low single digits, and rising inflation poses a risk of margin compression. Business spending will rise slowly due to delayed investments, though confidence is expected to improve.
U.S. Total Manufacturing, which tracks production volume, is experiencing mild growth and remains nearly flat compared to the same time last year (12/12 growth of 0.2%). Performance varies across the sector: some segments, like autos and heavy trucks, are still lagging, while others—such as chemicals and food production—are gaining momentum. ITR is forecasting that overall conditions improve by late 2025 and into 2026, with growth peaking around mid-2026 before transitioning into a slower growth phase by year-end. While 2027 will present more challenges, a soft landing is more likely than a recession.
SFSA Business Trends
To benchmark your facility with other steel foundry members, SFSA encourages you to participate in the monthly SFSA business trends survey – only participants have access to the results. The quarterly data will no longer be included in the Casteel Reporter. Please complete the business trends survey for June 2025: https://www.surveymonkey.com/r/SFSA_BTB_Jun25. Survey results are provided to participants the following month.
Casteel Commentary
Financial Challenges facing the Steel Casting Producer
Our current economic environment is chaotic, challenged by the unsustainability of long-standing financial and policy structures and practices, like quantitative easing, excessive debt, unsustainable and untouchable social programs. The evolutionary abandonment of historical disciplines in economics and geopolitics has led to changes in practices and policies without a clear identified path or leadership. The U.S. has faced the inability to remain the sole dominant economic and political power globally while much of the world is suffering from a demographic collapse of future generations and the economic fallout of de-globalization. De-industrialization especially of capital intensive industries like steel foundries is problematic.
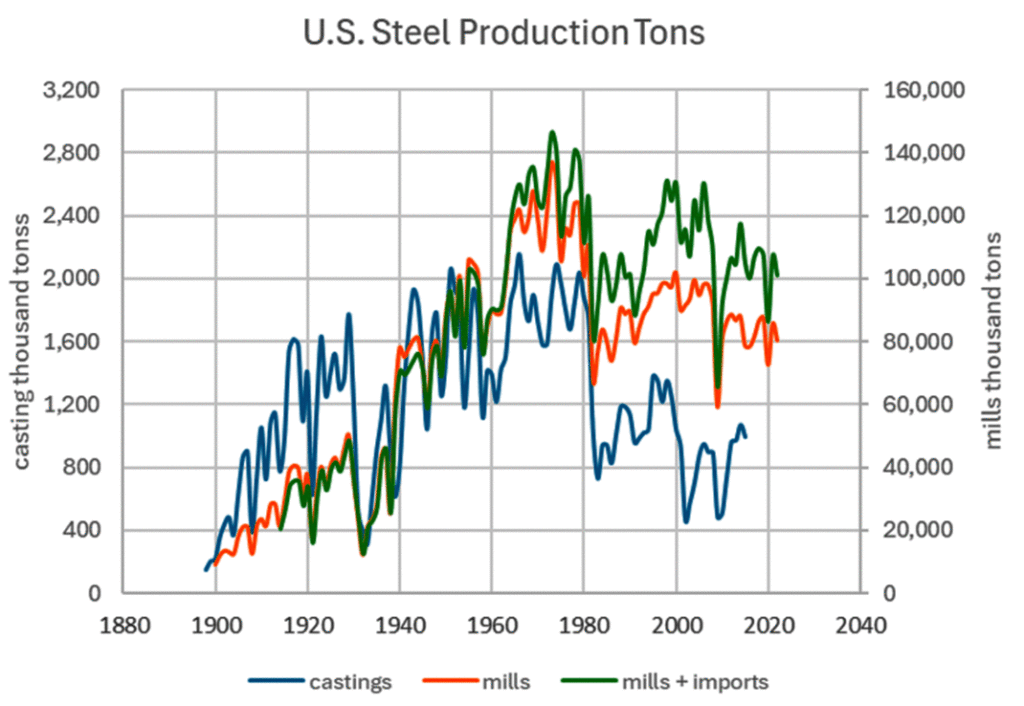
Figure 1 shows the history of steel mill and casting production in the U.S. Steel mill production has grown with the population and prosperity in an almost linear fashion since industrialization. This led to supplementing U.S. production post 1980 with mill imports and a sustained lower production of steel castings. Steel casting demand fell sharply after the infrastructure boom of 1960 to 1980. Some of the continued low levels of demand were the result of substitution including more capable fabrication, machining, alternative materials and ductile iron for volume production in the auto industry. Castings also suffered for the past 40 years from global supply. While direct substitution of imported castings for domestic products is limited in engineering products like steel castings, global casting suppliers for our customers’ production of their equipment reduced domestic demand. For commodity-like products in mining, the marketplace rapidly became global. For proprietary castings for equipment makers, developing offshore steel casting sources often resulted in those offshore sources displacing their customers’ manufacturing. These offshore sources either became the supplier of equipment to the domestic company or became their competitor. These offshore suppliers benefited from subsidies and lower cost conditions. Predatory subsidies to gain power and market access reduced global prices and domestic production.
Steel products are essential to the industry products required for modern life. Steel is the primary material for infrastructure and manufacturing. Steel foundry, forge, and mill production increased with population and development until 1980, Figure 1. What happened after 1980 that limited domestic mill steel and reduced casting production?
The U.S., as the dominant geopolitical player, has been led for decades by policy makers who believed that economic development around the world would lead to a prosperous and peaceful international system led by the U.S. and supported by most nations. This policy included the move to de-industrialization in the U.S. depending on globalization to provide the basic goods and materials needed for economic security.
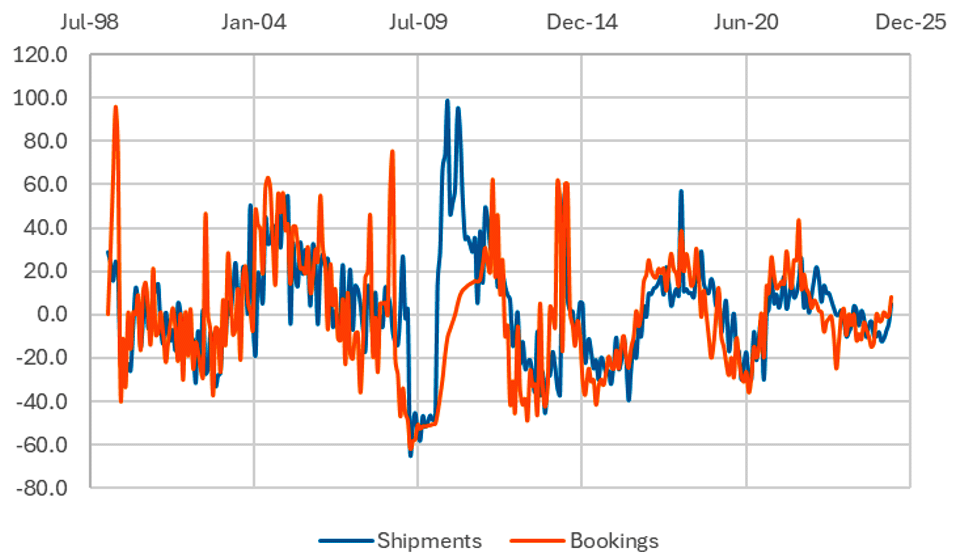
SFSA tracks business activity in steel castings, primarily in North America shown in Figure 2. A survey of members tracks the percentage change year over year reported for shipments and bookings. This data shows the volatility of over 60% that is characteristic of our industry. The financial crisis of 2009, the downturn in 2016, and Covid shutdown of 2020 are clearly seen.
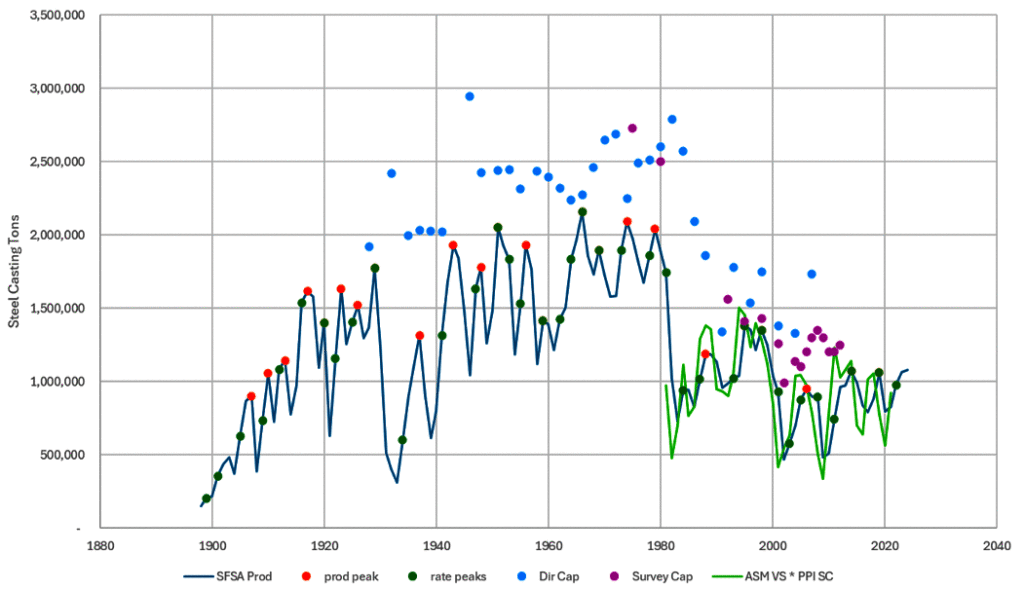
The production of steel castings in the U.S. reached a high level of over 2 million tons from 1950 to 1980, falling after 1980 to production around 1 million tons in peak years as seen in Figure 3. Capacity historically was set by the ability to melt and overstated the capability of the industry. Production in steel foundries is limited by other factors than melting. Peak production levels are the best measure of actual production capability which after 2000 is around 1 million tons.
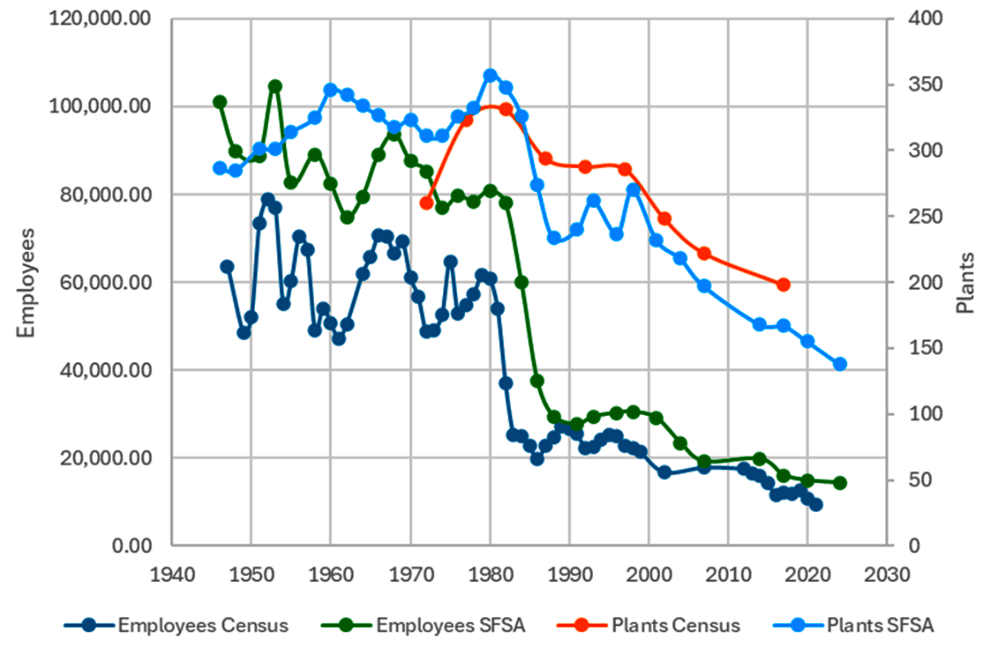
While the steel casting production capability remains around 1 million tons, improved efficiencies reduced the required workforce and plants. This has reduced the reported capacity from 1990 to now around 40%. The reduction in plants and employment is seen in Figure 4.
The current shift in policy recognizing the need for domestic suppliers of steel for economic and national security is likely to provide steel casting producers with opportunities for growth and profitability. This is unlikely to be orderly but to be forced by shortages and infrastructure breakdowns that affect our communities. We may be unable to keep the lights on. Power generation and other infrastructures seem most vulnerable.
Steel casting producers have suffered from a lack of profitable market opportunities as domestic customers lost their markets or developed their own global sourcing to be cost competitive. The idea that the U.S. industrial supply could retain its dominant position in design, development, and advanced products while not manufacturing equipment has been illusory. Without domestic production volumes to provide the cash flow and maintain the profitable investment, the industry declines. Engaging young people to discover the value and creativity in manufacturing is needed. SpaceX and Anduril have shown that this is possible.
Globalization led to customers for U.S. steel castings moving production of their products and the source their castings to foreign suppliers. While few steel castings are directly imported from China and the rest of the world, historical products that depend on steel castings have been imported in increasing numbers. Policy makers knew that domestic requirements could be made globally for less cost than in the U.S. In comparing prices after 1980 for products from the U.S. and global suppliers, U.S. producers were much higher in costs.
During the capital boom from 1960 to 1980, steel foundries in U.S. were at their capability and had pricing that allowed profitability and investment. New steel foundries were built and existing plants were expanded and modernized. All of the characteristics of limited supply were present. In 1979, U.S. steel foundries made 2.03 million tons. In 1982, the plants made 780,000 tons. For the next twenty years with the excess capacity, profitability in steel foundries and other steel products was limited.
One factor was the excess capacity did allow aggressive purchasers to chase the lowest price. Another factor that remains problematic was a shift in the late 1980s. Purchasers no longer saw suppliers like steel foundries as essential to their success. If there was an active marketplace, there would always be suppliers and collaboration was not important, the lowest price was. They no longer allowed margins for suppliers that included part of the product value beyond the cost of production. This 5 to 15% additional margin allowed plants to maintain and continue to invest in their plant and equipment. Since 1990, most purchasers are determined to push for the lowest cost targeting prices at the cost of production
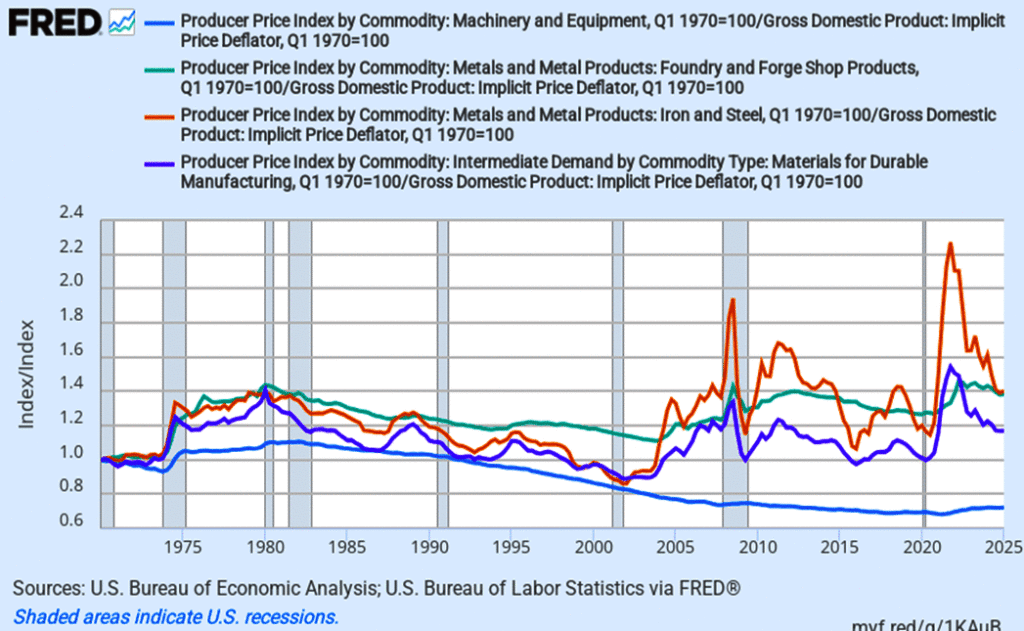
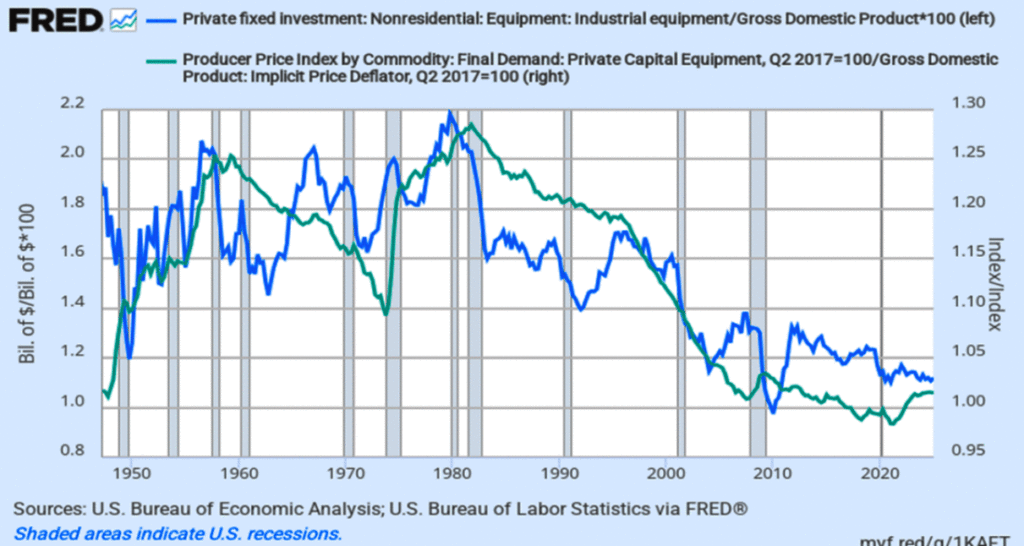
Figure 5 shows the relative value over time of machinery, steel products and materials for durable goods production. The value of these products can be estimated by the change in their prices in the Producer Price Index (PPI) for the product divided by the change in the value of the dollar, the Gross Domestic Product Implicit Price Deflator (GDPDEF). This change in value shows the capital investment cycle for these products. When capacity is limited and industry is near capacity, customers pay higher prices closer to the product value. When capacity is in excess, buyers pay prices tied closely to the cost of production. Since the depression of the 1930s, there was a peak in value in 1958, 1980, and then chaos in 2010 and 2021. After the peak in 1980, industry had excess capacity. Improvements in productivity allowed prices to be stable as the products’ value declined based on inflation.
For steel foundries, it was anticipated that with the liquidation in 1999 to 2003, demand from economic recovery and global growth would lead to rapid price increases that would allow domestic U.S. producers to refinance, reinvest and modernize. Instead, globalization resulted in much of the investment being directed to China to allow large multinational organizations to tap into their large and growing market. Figure 5 shows the influence of monetary policy with the abandonment of the gold standard in 1972 and the change in Federal reserve policy in 2009. These changes are unremarked among policy makers but are a part of the current uncertainty seen in the volatility in values post 1972 and 2004 and markets in Figure 2.
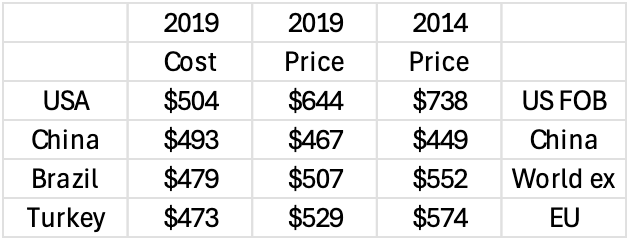
It is possible to see the direct cost of production and the market prices in different regional economies for steel mill products for 2019 to 2020. There was a study done to determine the direct cost of making Hot Rolled Coil steel (HRC) in the major steel producing countries. The price of this product in different regional economies is also reported monthly, This allows a comparison of direct production costs and prices. Figure 6 shows the cost and regional selling price for a ton of hot rolled coil for the major steel making areas in 2019. This was in a declining market with global excess capacity and reflects competitive prices driven close to the cost of production. There is only a 6% difference between the U.S. total direct cost to make the steel and Turkey with the lowest costs.
Production cost in the U.S. is not an explanation for the pricing. China which is the dominant maker of steel globally had production costs less than 2% lower than the U.S. with prices. In pricing, China had the lowest price that was 27% below the price in the U.S. Their price was below their cost. EU was 18% lower than the U.S. The world price was 21% below the U.S.
Why is the U.S. price for steel in 2019 so much higher than the rest of the world? One thought would be that in 2019 there were steel tariffs of 25% added in 2018. This explanation will not work since Figure 6 includes the same pricing information for 2014, pre-tariffs and in a normal market. Prices in the U.S. during this pre-tariff year were 39% lower in China, 26% above the world and 22% above the EU. It is common to find that the EU is 20% below the price of the U.S. and 40% for China and other regions. Price differences were greater before the 2018 tariffs.
This type of information is also shown in Figure 7. In 2019, the industry was in a declining ordinary market with excess capacity and sold close to cost of production. With Covid in 2020, demand for steel collapsed and was sold at liquidation prices. These prices reflect the out-of-pocket costs for the inventory to generate cash flow and maintain limited production. With the strong recovery in 2021 steel mills could not meet the demand so prices reflected more the value of the steel for the purchaser rather than the cost of production to the plant. Since 1980, purchasing culture has driven the pricing to minimal levels and not been concerned that their suppliers can re-invest, innovate and modernize.
The market clearing price, the normal current price, is set in markets with excess capacity close to the cost of production of the plant that the last purchaser needs. Since there is excess capacity, several producers want the business, and the purchaser can negotiate a price close to the cost of production. Successful plants in this excess capacity market must drive their costs lower than their competitors’ to be able to remain profitable with these low prices. Profitability is driven by the cost of production. This is the picture drawn in 2019 in Figure 6. In 2021, when the market collapses, producers of commodity products like HRC try to maintain cash flow and their employees and sell the inventory to recover the embedded direct costs. This is what happened in late 2019 and 2020 as seen in Figure 7. The cost of production saw a small drop and the prices fell slightly showing that the prices in 2019 reflected the cost production with little margin for investment.
When the existing suppliers are unable to meet the demand, purchasers must find sources to make their own products and sell in an active market. The market clearing price rises being set not by the last purchaser for the production but by the producer with the last remaining capacity. Multiple purchasers bid for that product. The price rises to the value of the product for their business. Profitability for the producer is driven by the product throughput. Prices rise not by aggressive bid responses but are proposed by purchasers to gain the production they need for their business. With long backlogs, purchasers with valuable opportunities are willing to pay more than the cost of production to break into the front of the line and buy product. They bid up to the value that the product contributes to their business. This leads to significant increases. The value of the product is typically more than twice the cost of production. That is why purchases happen.
The prices charged by steel foundries and mills in the U.S. being higher than global competitors is not due to manufacturing inefficiencies and poor management, it reflects the cost of doing business in the U.S. Global trade has many factors that burden capital-intensive businesses in the U.S, that limit our core need, higher profitability. One set of factors which is both a benefit and a cost is our currency and tax system. We are the largest economy and a target for global suppliers.
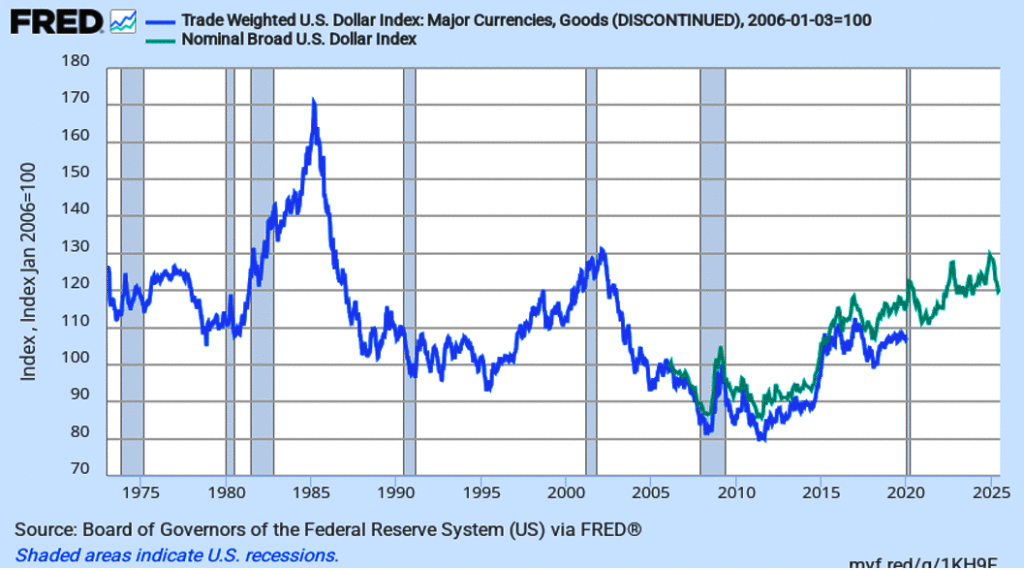
The dollar remains to reserve currency of the world and capital-intensive industries are at the mercy of currency value changes. The peak of the dollar in the mid-1980s and 2000s corresponded with import concerns from Japan and China seen in Figure 8. In both cases, the capital-intensive steel industry was the poster child for domestic manufacturing for security concerns.
Moving from regional economies typical pre-1980 to global competition shifted the commercial framework for the competitive markets for goods. In regional economies, policy makers can add economic externalities to manufacturing firms and if regional producers have a robust market with an adequate number of competitive firms, the cost of manufacturing + externalities is minimized. The cost of these externalities that are public goods that are paid in the region that imposes these costs and gets the benefits. In a global marketplace, regional policies and costs outweigh manufacturing value creation for capital-intensive goods. This is especially true when regions like China that are targeting these products to achieve a dominant geopolitical role.
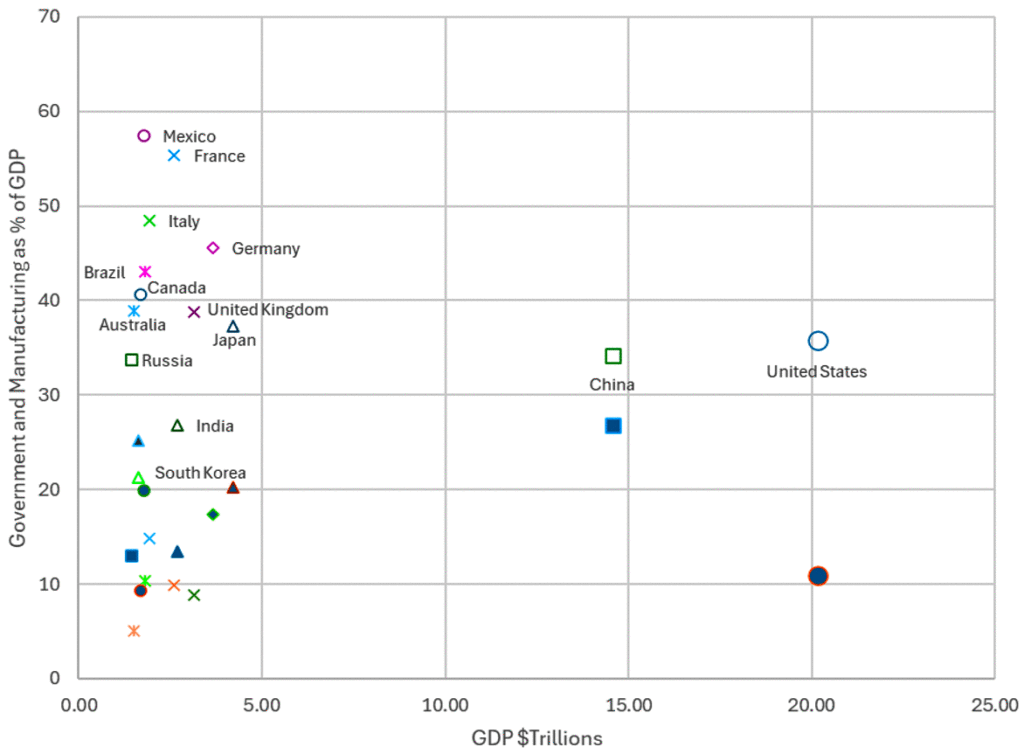
Figure 9 shows the challenge in a global market for manufacturing. In the figure, the open symbols for each country are the percent of GDP of government expenditures and the filled symbols are for their manufacturing output as a percent of GDP. Government is a much larger part of the economy than manufacturing.
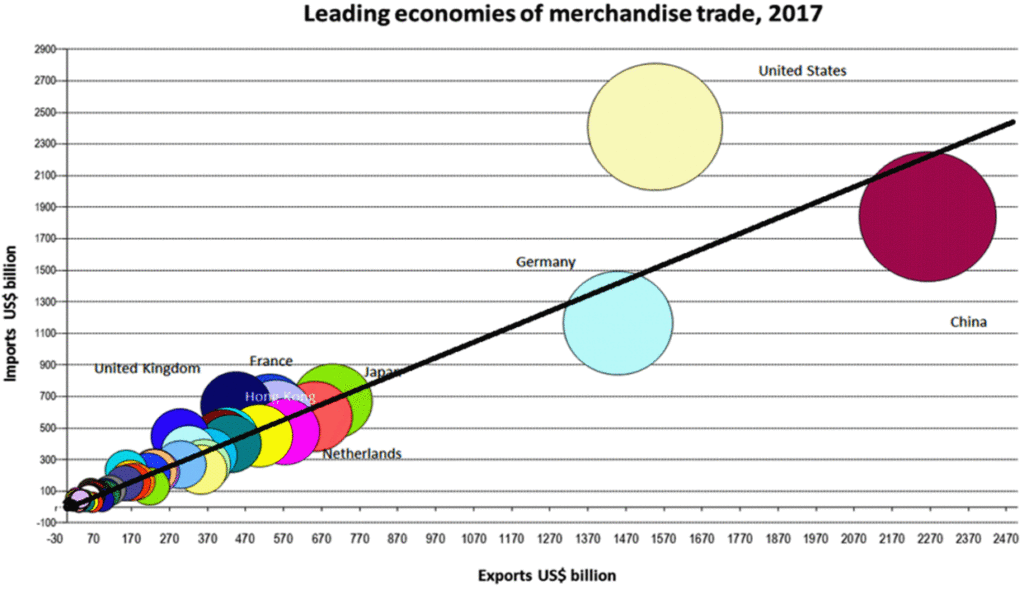
The U.S., China, and Germany are the largest traders with the U.S. the importer and the others as exported of manufactured good shown in Figure 9. Outside the U.S., policy makers are aware of the need for manufacturing to maintain national and economic security and have policies to maintain this capability.
The U.S. with the global currency and largest economy has public policy that benefits from imports. The U.S. is the largest net importer of merchandise and China and Germany are the largest exporters. China exploited their ascension to the WTO to become a dominant processor and supplier of most of the materials needed for a modern economy. Germany used their high-end capability to export advance products globally. While the current efforts in the U.S. to address the trade balance are chaotic and incoherent, Figure 10 shows the challenge. The U.S. is the destination for the bulk of exported goods. Market Competition was regional but after 1980, regional firms competed with other regional producers. Competition in global markets remains a market decision but the major competitive factor for steel is not plant level efficiency but the regional public policy.
Global competitiveness for regional producers is more a factor of public policy than manufacturing capability. Figure 11 shows the change in value for private capital equipment in the U.S. The peak value of this equipment in 1958 and 1980 is clear. This can be seen in the fraction of the gross domestic product (GDP) that was industrial equipment. This fraction has fallen to 1.1 % of GDP from over 2%. Part of that fall as a fraction of GDP is the explosion of value and growth in IT and associated technology, services and non-manufacturing. The dominance and size of services shapes our public policy. The policy that was unconcerned with retaining core capability in industrial production.
Policy makers were convinced that domestic requirements could be made globally for less cost than in the U.S. In comparing prices after 1980 for products from the U.S. and global suppliers, U.S. producers were much higher in costs. Policy experts attributed this pricing to inefficiencies in U.S. production but the direct production cost does not support that idea as shown in Figure 6 and Figure 7.
The election of Trump 1 included a push back on this consensus view with tariffs imposed on steel of 25%. While criticized and opposed by policy makers and economists, these tariffs were retained and expanded by the Biden administration. Covid demonstrated the need for core industries including steel castings to ensure economic and national security. One issue going forward is the requirement of large infrastructure and industrial investments including castings. The lack of a clear path and proposed future structure to replace global supply chains and deal with the demographic future is problematic
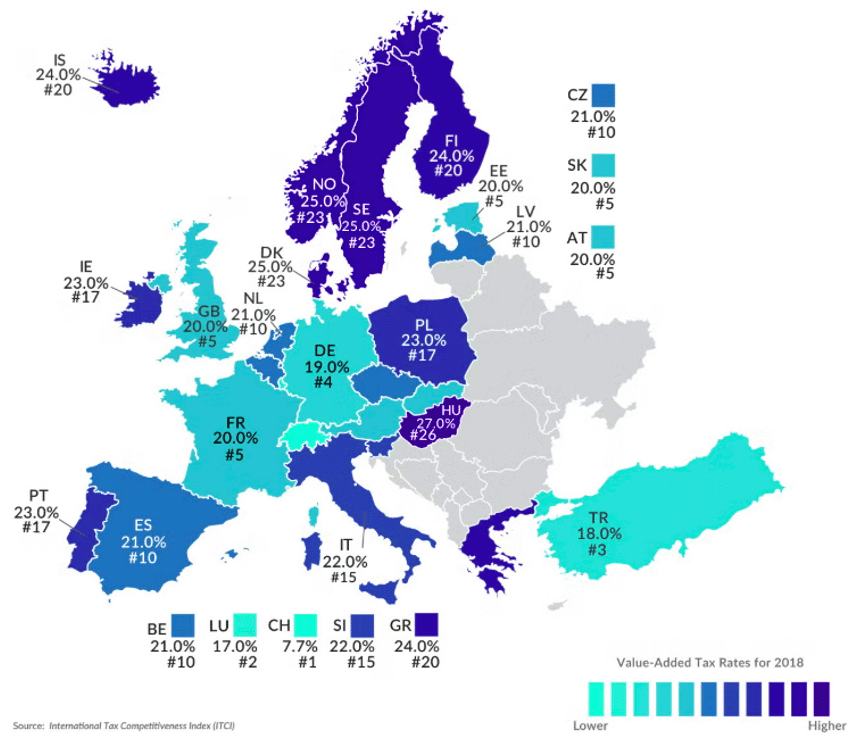
It would be expected that the capital-intensive manufacturing in the EU would have cost externalities similar to the U.S. and prices would reflect that parity. As could be seen earlier, their cost of manufacturing is higher than in the U.S., but their pricing is lower. One advantage in goods is the different tax system that allows border adjustability for the Value Added Tax (VAT) in Figure 12. Macro-economists are confident that the border adjustment is not trade distorting as the currency values adjust to accommodate this policy. VAT is almost exactly the price benefit that the EU producers enjoy. These economists also dismiss the cost of the dollar being the world’s reserve currency as a factor in trade. Shifts in currency values are well understood in industry to affect trade even though, like the VAT, the economists are confident that prices adjust quickly and with precision to eliminate this trade effect.
While economy-wide these assumptions may have value, in capital-intensive industries critical for security, these issues hurt domestic producers and result in low profitability that makes the industry unattractive for investment.
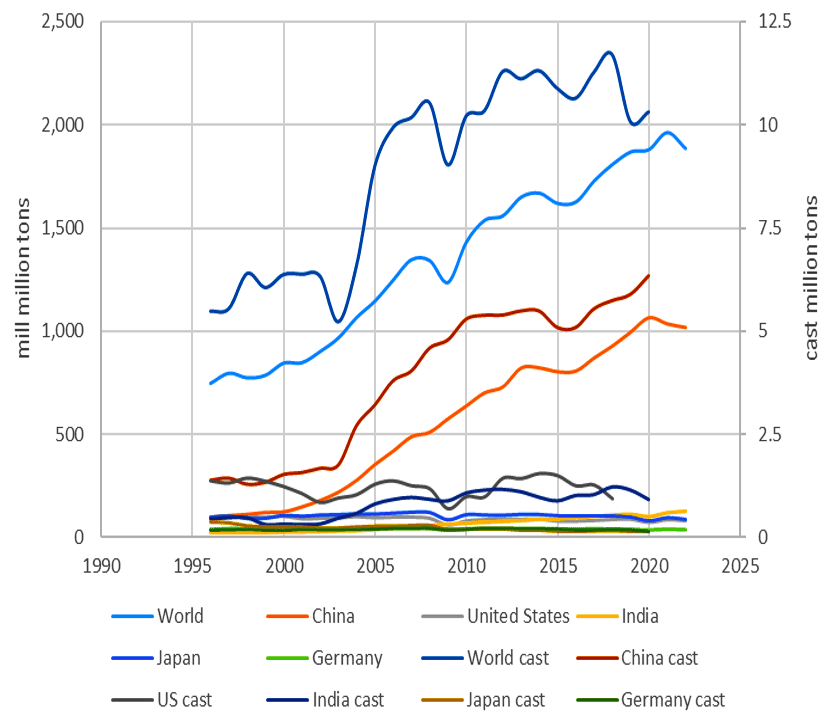
China had an explicit and comprehensive strategy to replace global suppliers of most of the significant industrial materials for industry and dominate consumer products. As seen in Figure 13, China was at parity with other steel producers in the mid-1990s and added capacity to become larger than the rest of the world combined. As seen in Figure 6, their mills have no competitive advantage in productivity or cost but have financial and policy support to become the dominant supplier. The same is true of steel castings.
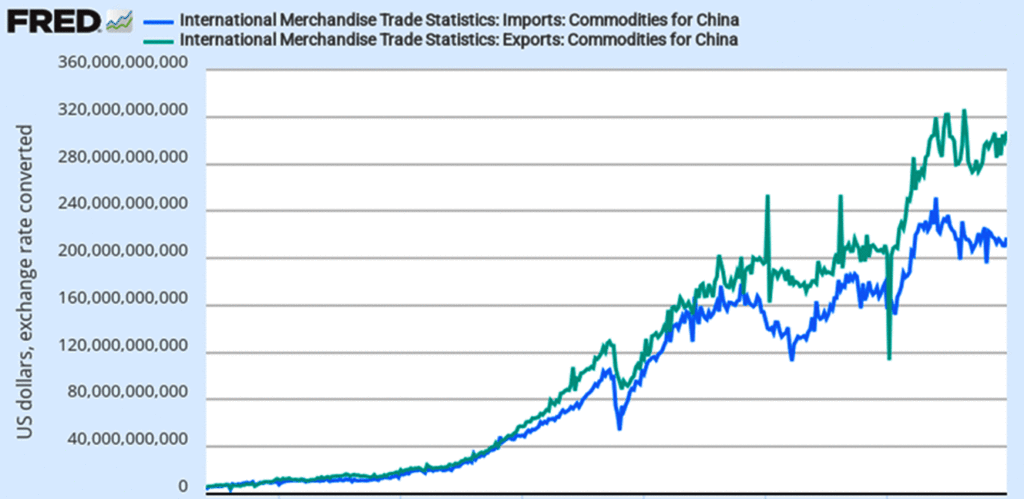
China used the size and resources of their economy to target the critical production of the intermediate materials needed by the world as seen in Figure 14. Their dominant position in steel is a typical example where they have no inherent economic advantage but invested to become the largest producer. China makes more steel than the rest of the world combined. With the recent shift in policy including tariffs on China, their direct exports of steel to the U.S. are minimal. It still allows them to undercut domestic producers in downstream products. They all game the systems with trans-shipments, mislabeled products and collaborating with other countries to allow them to add value and ship intermediate or final products using Chinese materials. This damages not only the steel producer but also our customers. The graph shows that their import/export effort is not from domestic resources but by refining and producing industrial materials and products.
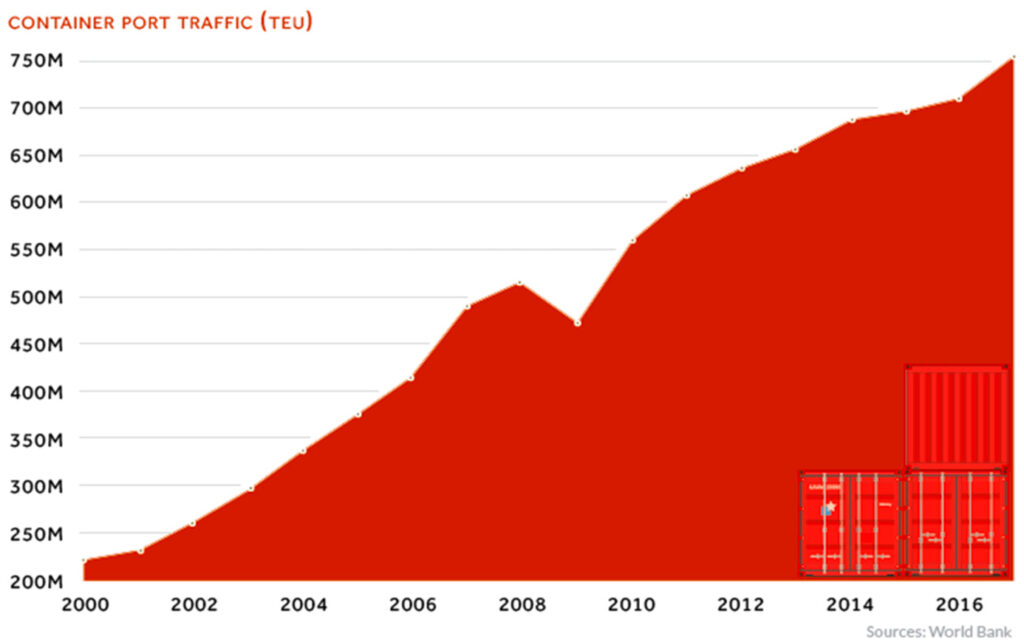
Beyond the economic conditions, changes in purchasing cultures and policy imposed external costs, globalization had a dramatic impact on the ability of capital-intensive industries like ours to be profitable enough to invest and develop the production and capability to support economic and national security. Policies that supposed that global suppliers were cheaper than domestic sources were correct but the cause was not our inefficiencies or product value but our regional costs. Containerization enables globalization as seen in Figure 15. https://www.visualcapitalist.com/global-shipping-container-traffic/
Global trade rules were established prior to containerization. In that time, commodity products could be shipped economically but specialty products were difficult, expensive and risky to ship. Containerization made shipping small lots of specialty products economical, safe and affordable. (https://www.sowlv.com/containerization-how-a-metal-box-changed-the-world)
Moving from bulk commodities to containers:
• Costs of shipping cargo have dropped more than 90%.
• In 1956 cargo cost were about $5.86 per ton pre-containerization, to $0.16 after.
• In 1966 just over 1% of all countries had shipping container ports. In 1983, 90% of countries had them.
• Pre-containers, cargo was loaded at around 1.3 tons per hour. With containers, this increased to 30 tons per hour.
• In 2011, American shipping ports received $1.73 trillion worth of goods.
• There are more than 6,000 container vessels in service today.
This shift in trade technology allowed predatory trade practices to be employed on specialty products like steel casting and products containing steel castings globally.
Trade laws developed over 50 years ago were targeted at predatory trade practices in bulk commodities. Transportation was difficult and expensive for small specialty products like steel castings. Tariffs were prevalent. Tariffs are seen as antiquated and irrational even though the “free” trade agreements are thick documents with targeted tariff rates on a wide variety of products. Lower tariffs were only implemented in the U.S. after WWII. The U.S. had the benefit of no damage to domestic industry unlike virtually all competitors and were not subject to significant trade deficits.
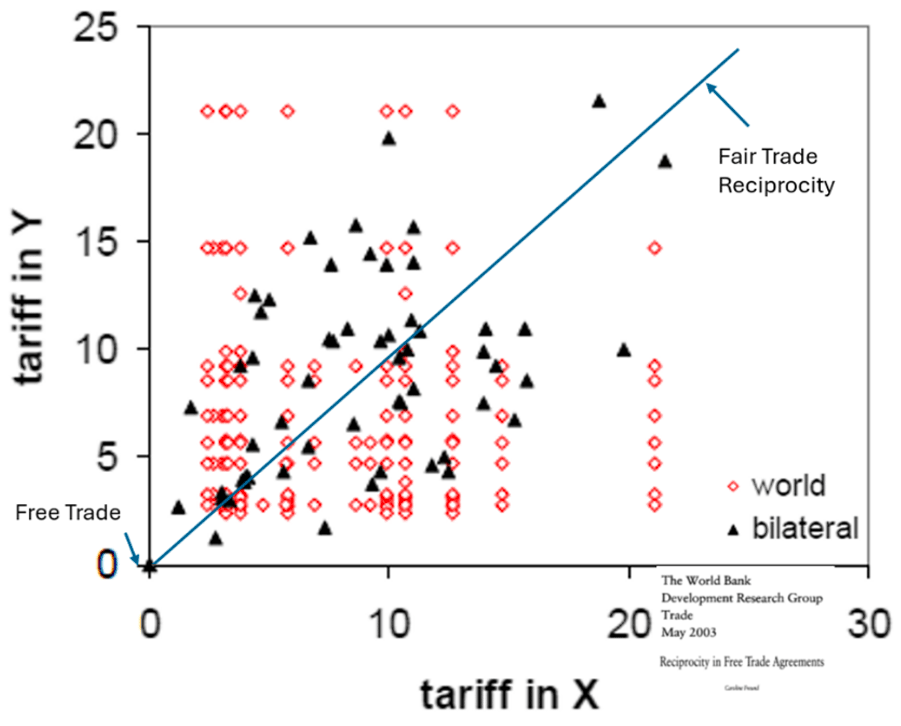
Trade laws to prevent market distorting practices like antidumping and counter vailing duties have been applied to commodity shipments but the cost, time and remedies provide no relief from these predatory practices. The U.S. trade policy defined fair trade as evenhandedness not as reciprocal treatment. We had the same rules for China and Canada. Free trade implied the elimination of tariffs for goods but as can be seen in Figure 16, tariffs in 2003 before the imposition of U.S. tariffs, global trade was not fair or free. Free Trade Agreements are thousands of pages long negotiated over for years for each participant to protect their own markets and gain access to others. A principal driver is for other countries to gain entry into the U.S. market.
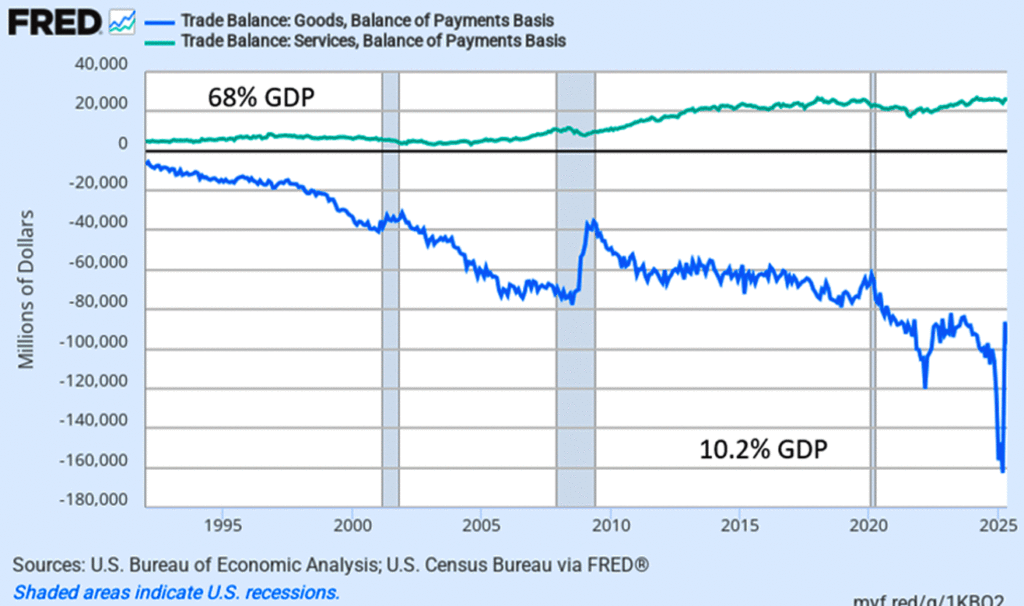
Trade policy is a typical geopolitical framework where high ideals and intentions are actualized as mercantilist policies to protect and extend competitive local industries globally. For the U.S. this means negotiating benefits for services at the expense of concessions on goods, Figure 17.
U.S. good manufacturers are also disadvantaged because services are at the trade surplus and policy makers anticipating de-industrialization were accepting of damage to core manufacturing in exchange for access and protection for services.
Globalization was a huge benefit for the world economy and allowed developing countries to participate in modernization, raising their standard of living and reducing poverty. It resulted in supply chains that were dispersed across the globe using and exploiting the skills, talents, resources and policies of countries. Large corporations and agencies created supply chains with access to new markets and exploiting lower costs. The U.S. negotiated trade agreements not to achieve reciprocity to allow market values or production to determine sources domestically but evenhandedness that allowed us to benefit from global sources that supported their producers to gain markets. The U.S. prioritized services in trade agreements as the largest part of the economy and more profitable.
Public policy in the global financial system is structured so that capital intensive producers are not profitable enough to be attractive investments. Economic externalities are costs to society as a whole. Public policy imposes these costs on manufacturing as seen in the pricing in Figure 8. The predatory and deliberate policy of China and the willingness of North American public policy to abandon capital-intensive industries has led to lack of profitability. The reason for the lack of innovation, modernization and automation that would make the industry competitive is the lack of profitability from the overcapacity in the global economy. Covid showed the vulnerability of the global economy to geopolitical events that could threaten both economic and national security.
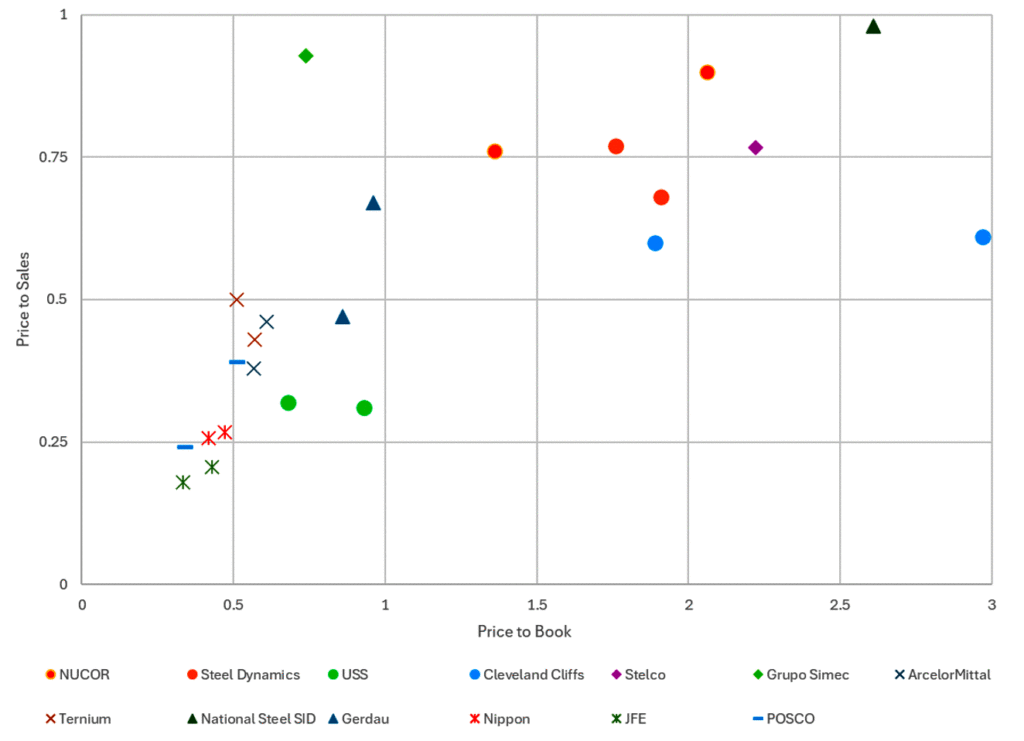
Excess capacity and geopolitical policies have made steel and other capital-intensive industries inadequately profitable as sunk cost investments. The coming demographic and globalization collapse should result in a resurgence. Figure 18 show the price to book and price to sales of major publicly traded steel mills for 2019 and 2020. The book value of the company exceeds its price in the market determined from the market capitalization. When the is price of the company is less than the book value, it is a sunk cost investment.
The value of the business is too large to abandon but the profitability is too low to make significant investments or have the capital needed for innovation. Other similar firms may buy failing firm at an attractive cost or to gain market access in the U.S. U.S. investors are generally unwilling due to the low profits, uncompetitive global policies, excessive costs and liabilities. These limits are not due to the business management or performance but to an unintended series of public policies.
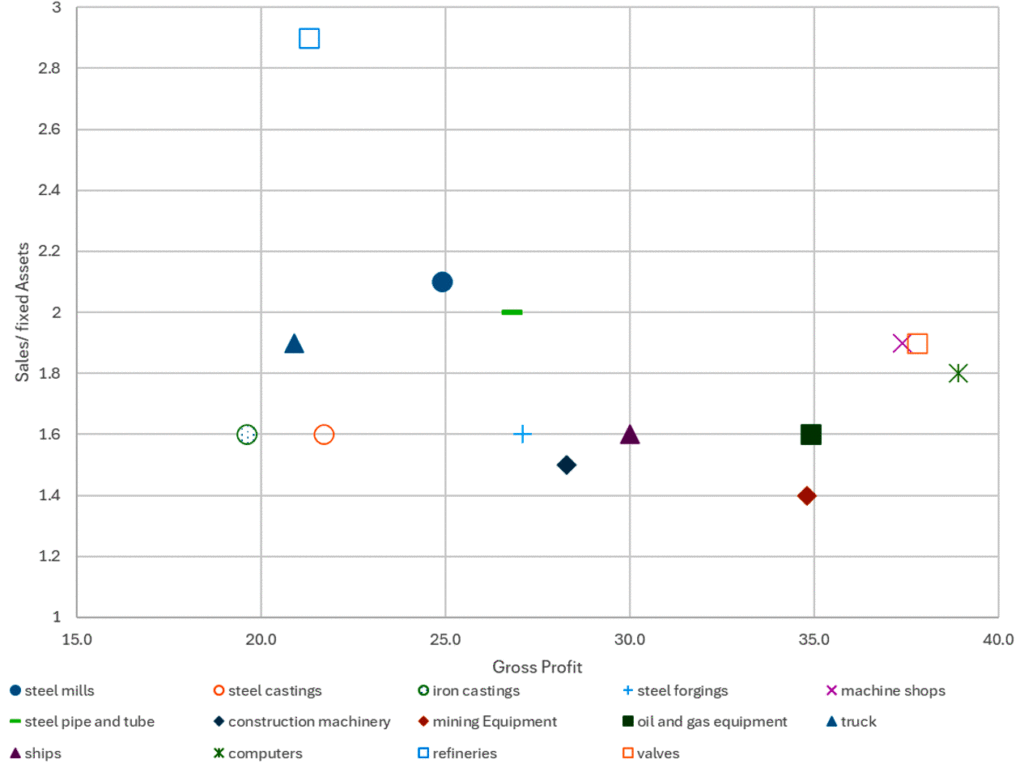
Figure 19 shows the low sales compared to assets and low profits of the privately held steel and equipment producers. Steel foundries have low gross profits and low sales compared to assets.
Many steel foundries are run as sunk cost investments investing enough to operate and be profitable enough to continue in business. The concern about capacity though has awakened interest in the U.S. in acquiring steel foundries by investment groups.
The U.S. for economic and national security need adequate domestic capability and is endeavoring to incentivize investment in core manufacturing sector. It is not clear that economists, policy makers or investors have found a way to create a framework for sustained profitability for us to be able to be a secure and capable supplier of the essential steel castings needed for our future!
Raymond
| STEEL FOUNDERS' SOCIETY OF AMERICA BUSINESS REPORT | ||||||||||
|---|---|---|---|---|---|---|---|---|---|---|
| 12 Mo Avg | 3 Mo Avg | May | April | March | ||||||
| Department of Commerce Census Data | ||||||||||
| Iron & Steel Foundries (million $) | ||||||||||
| Shipments | 1,691.10 | 1,773.00 | 1,761 | 1,783 | 1,775 | |||||
| New Orders | 1,700.90 | 1,751.30 | 1,812 | 1,752 | 1,690 | |||||
| Inventories | 3,314.60 | 3,298.70 | 3,323 | 3,290 | 3,283 | |||||
| Nondefense Capital Goods (billion $) | ||||||||||
| Shipments | 85.8 | 86.3 | 87.2 | 87.3 | 84.4 | |||||
| New Orders | 90.3 | 108.5 | 130.3 | 87.2 | 107.9 | |||||
| Inventories | 238.1 | 249.5 | 249.7 | 249.3 | 249.5 | |||||
| Nondefense Capital Goods less Aircraft (billion $) | ||||||||||
| Shipments | 74.4 | 75.5 | 75.7 | 75.4 | 75.5 | |||||
| New Orders | 74.5 | 75.4 | 75.9 | 74.6 | 75.8 | |||||
| Inventories | 169.5 | 182.2 | 182.5 | 182.1 | 182 | |||||
| Inventory/Orders | 2.3 | 2.4 | 2.4 | 2.44 | 2.4 | |||||
| Inventory/Shipments | 0 | 2.4 | 2.41 | 2.42 | 2.41 | |||||
| Orders/Shipments | 0 | 1 | 1 | 0.99 | 1 | |||||
| American Iron and Steel Institute | ||||||||||
| Raw Steel Shipments (million net tons) | 7.2 | 7.6 | 7.5 | 7.6 | 7.7 | |||||
