Table of Contents
79th Technical & Operating Conference
The T&O Workshop and Conference will be December 10-13 in Chicago.
Understanding Casting Yield Webinar for Customers
This educational webinar discusses what casting yield is and how it along with other factors drive the manufacturability for castings. It provides an overview of the manufacturing steps for making a casting along with the trade-offs involved in making cost-effective, steel geometry that meets the part performance requirements of the customer. The panel also highlights what are the primary foundry engineering factors for casting yield, and how a customer can collaborate with a foundry to optimize a casting.
SFSA Safety Awards
It is time to participate in the SFSA Safety Award Program! To be eligible for safety awards, participants must report a safety record DART for 2024 that is equal to or less than 1.8. This is the composite average for all manufacturing industries. We will be awarding “Perfect” and “Outstanding” awards.
If you’re 2024 DART rate is 1.8 or lower, you need to fill out the online application no later than September 12, 2025 to be eligible for a safety award. Member companies achieving a safety record less than or equal to 1.8 will receive a certificate; companies achieving a perfect record with a DART Rate of 0 will receive a plaque. Safety award recipients will be recognized during the SFSA T&O Conference in December.
Apply here: https://www.surveymonkey.com/r/SFSA_SafeT_25
Cast in Steel 2026 – Horseman’s Axe
Cast in Steel 2026 Season 2 will be a competition to produce a Horseman’s axe using casting.
Teams will compete to design and cast a one-handed horseman’s axe, inspired by the legendary weapon used by Robert the Bruce at the Battle of Bannockburn in 1314.
Grand Prize: $25,000
Key Dates:
- December 5, 2025: Team proposals & preliminary plans due
- March 27, 2026: Project video, technical report, and axe shipment due
- April 15, 2026: Students Arrive
- April 16-17, 2026: Performance testing
NOTE: Please be advised that no axes will be returned. All entered axes will be auctioned through SFSA. Proceeds from the auction will be used to benefit the participating universities.
More info: castinsteel.org
Casting Dreams 2026 – Host or Sponsor a Local Competition!
Casting Dreams is a national metalcasting competition for students ages 8–18, created by SFSA. Participants design and cast original metal objects (10 lbs. or less) using scratch or custom molds.
We’re inviting foundries and organizations to host or sponsor local events. Local winners advance to the National Finals at the Metalcasting Congress in April 2026 (Grand Rapids, MI).
Sign up: https://castingdreams.org
Questions? Contact Renee Mueller at rmueller@sfsa.org
Let’s inspire the next generation!
Market News
ITR reports that GDP rose in the second quarter, coming in 2.0% above 2Q24. After a first-quarter surge in imports ahead of tariffs, the second quarter saw a pullback in both imports and inventories. Consumer and business spending posted mild gains. Leading indicators point to additional GDP growth ahead.
US Nondefense Capital Goods New Orders (excluding aircraft) and US Industrial Production remain in accelerating Growth trends, setting the stage for modest expansion through 2026 and into 2027. With companies in relatively stable financial positions, a gradual rise in capital goods investment is anticipated as businesses adapt to elevated borrowing costs and as policy uncertainty eases.
The U.S. manufacturing sector is strengthening overall, though performance differs by market: automotive and heavy-duty trucks remain in recession due to tariff-related supply chain pressures, while construction machinery and defense capital goods received outlook upgrades on easing constraints, higher prices, and increased defense spending amid geopolitical tensions.
MetalMIner reported that U.S. metals markets experienced extreme volatility under tariffs of up to 50%, disrupting cost structures and demand. The Aluminum MMI rose as the Midwest Premium hit a record $0.71/lb (+167% YTD), breaking its usual correlation with LME prices, while the Copper MMI swung sharply after tariffs drove a Comex spike that later eased with exemptions. The Raw Steels MMI firmed even as mills discounted material on weak demand, and the Stainless MMI held steady despite falling nickel costs, supported by resilient downstream demand. Rare earths edged higher amid U.S.–China tensions.
SFSA Monthly Business Trends Survey: https://www.surveymonkey.com/r/SFSA_BTB_Jul25
SFSA Market Forecast
The SFSA Marketing Committee is working on the 2026 SFSA Market Forecast. The committee would appreciate receiving your input on the markets that you serve in support of the forecast. Please take a moment to complete the market forecast survey: https://www.surveymonkey.com/r/4cast2026. Responses are kept confidential and will be aggregated with other member responses.
Casteel Commentary
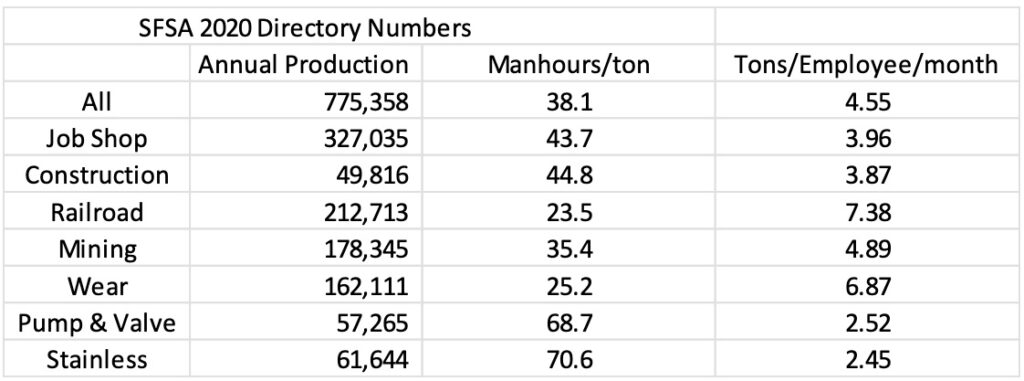
Labor productivity is a problematic measure. A traditional measure for productivity was the labor hours per ton of production. This measure can be internally useful but depends fundamentally on the type of products that the foundry makes.
One way of analyzing the data is to take the SFSA Directory information and take the estimated annual production capability divided by annual hours or number of employees shown in Figure 1.
This crude estimate shows the challenge of product type. We have normally separated the industry into Rail Mining, Job Shop, and High Alloy. Figure 1 shows more categories separating by type of foundry or material. We match the mill production in a rough ratio of 10% stainless compared to normal steel alloys.
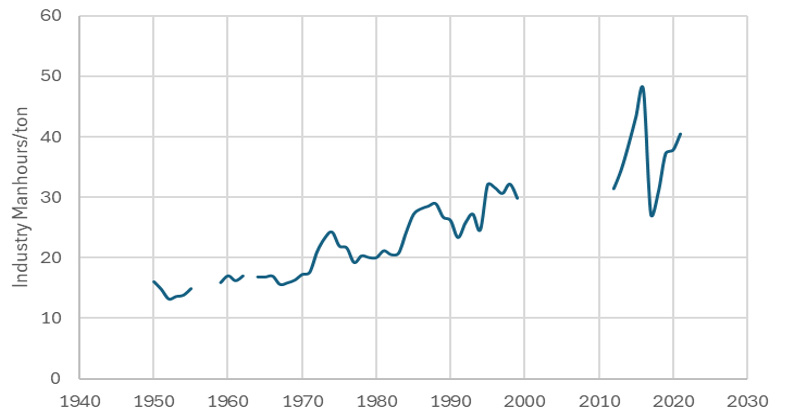
In Figure 2, the Census data for production hours used with the production tonnage give a global manhours per ton that shows the increase in tonnage productivity over the decades.
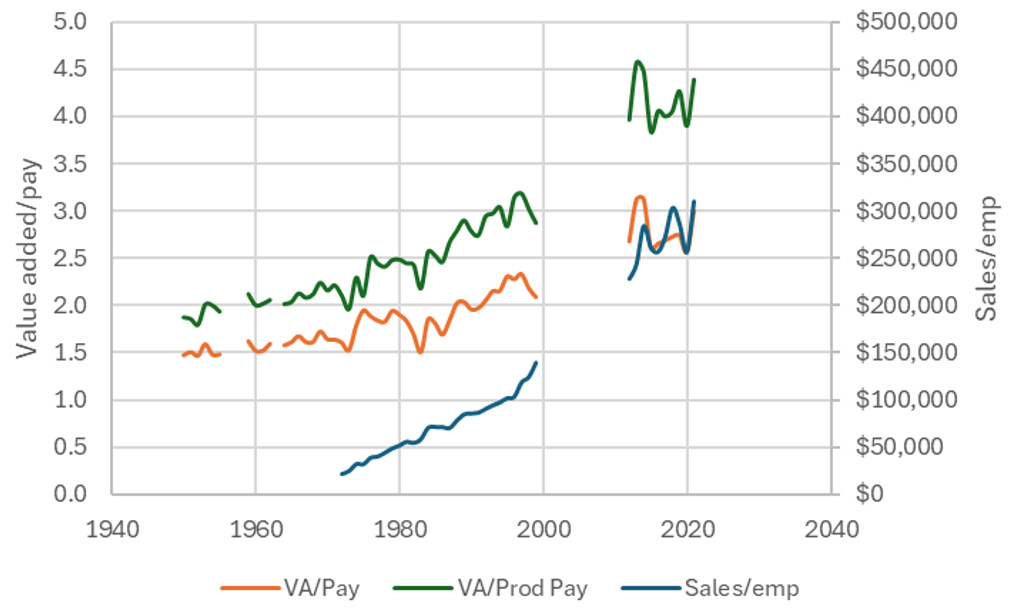
In Figure 3, the annual sales per employee are shown. This is a problematic measure that can be high if the products made are an assembly of expensive components. With the recent movement in values, this number is higher than in the past.
A more meaningful measure of labor value is the value added per cost of labor. Two lines are shown, the higher is the ratio of value added to production payroll. The lower line is the value added per total payroll. Both show a dramatic increase in productivity historically. In the post 2000 time, the increase in the cost and value of materials relative to labor shows a dramatic increase in the financial productivity of labor.
All of these global estimates of our industry productivity shows an ongoing improvement in our capability.
Raymond
| STEEL FOUNDERS' SOCIETY OF AMERICA BUSINESS REPORT | ||||||||||
|---|---|---|---|---|---|---|---|---|---|---|
| #colspan# | 12 Mo Avg | 3 Mo Avg | June | May | April | |||||
| Department of Commerce Census Data | ||||||||||
| Iron & Steel Foundries (million $) | ||||||||||
| Shipments | 1,705.70 | 1,792.70 | 1,811 | 1,784 | 1,783 | |||||
| New Orders | 1,731.50 | 1,846.00 | 1,923 | 1,863 | 1,752 | |||||
| Inventories | 3,320.10 | 3,296.00 | 3,287 | 3,311 | 3,290 | |||||
| Nondefense Capital Goods (billion $) | ||||||||||
| Shipments | 85.9 | 87.1 | 86.5 | 87.3 | 87.3 | |||||
| New Orders | 93.2 | 105.7 | 99.2 | 130.7 | 87.2 | |||||
| Inventories | 239.5 | 249.6 | 249.8 | 249.6 | 249.3 | |||||
| Nondefense Capital Goods less Aircraft (billion $) | ||||||||||
| Shipments | 74.5 | 75.6 | 75.9 | 75.7 | 75.4 | |||||
| New Orders | 74.7 | 75.4 | 75.4 | 76 | 74.6 | |||||
| Inventories | 171.2 | 182.6 | 183.1 | 182.5 | 182.1 | |||||
| Inventory/Orders | 2.3 | 2.4 | 2.43 | 2.4 | 2.44 | |||||
| Inventory/Shipments | 0 | 2.4 | 2.41 | 2.41 | 2.42 | |||||
| Orders/Shipments | 0 | 1 | 0.99 | 1.01 | 0.99 | |||||
| American Iron and Steel Institute | ||||||||||
| Raw Steel Shipments (million net tons) | 7.3 | 7.6 | 7.9 | 7.5 | 7.6 | |||||
